Author: Timo Tautenhahn

  • Tableau Extensibility Framework – More Use Cases

    Tableau Extensibility Framework – More Use Cases

    This post is a follow-up of the “Tableau Extensibility Framework” blog post which talks about a very interesting advanced analytics manufacturing use case. The video below shows 2 more scenarios of how you could leverage the very same framework for:

    • generating geographical data at the time of analysis in order to optimize the workbook for performance AND generate data which is missing in order to correct upcoming questions (as missing data could lead to wrong conclusions)

    • leveraging machine learning to find similar contracts/cases/data points in external applications/systems/databases to learn from decisions which already have been made in the past to make it more likely to 
      • close a deal
      • solve a support ticket faster
      • make a smarter data driven decision based with AI/ML support

    I’m looking forward to hear your ideas around what you’d like to achieve with such an extension after you’ve watched the video. So please actively use the comment section underneath.


    Demo


    S

  • Tableau Visualization Extensions

    Tableau Visualization Extensions

    Today Nathan Mannheimer (Director, Data Science and ML Products at Tableau) and Andrew Beers (Tableau CTO)  publicly announced that Tableau will introduce “Tableau Visualization Extensions“! The community asked for it since years and the preview in today’s “Devs on Stage” session at the Virtual Tableau Conference 2021 looked amazing! I can’t wait to get my fingers on it and to share with you new ways of how to visualize data! What are the first visualization types you’d like the community and myself to create for you?

    If you couldn’t join the American live stream make sure you login at Friday November 12th at 10:00 AM Central European Time (UTC +1).


    Tableau Visualization Extensions – End User Experience

    Outlook Calendar Blocker -Tableau Conference 2021 Devs on Stage
    Google Calendar Blocker -Tableau Conference 2021 Devs on Stage

  • How to configure Tableau Online Single Sign-On with Salesforce as Identity Provider?

    How to configure Tableau Online Single Sign-On with Salesforce as Identity Provider?

    Hi Tableaufans,
    Integrating Tableau into Salesforce is more important to customers than ever before! Since Salesforce announced Tableau’s acquisition in 2019 the platform of Salesforce and Tableau are getting closer and closer together. Even prior to the acquisition announcement customers have been integrating Tableau into Salesforce! In order to have a smooth user experience you don’t want users to login twice! That’s why single sign-on is crucial for administrators setting up the environment for internal users as well as external customers! Yes, you’ve been reading it correctly, you can also integrate Tableau into Salesforce in order to monetize data you’ve got in your corporate data lakes! With Tableau in your infrastructure you also don’t necessarily need to move all of your data into Salesforce!

    For example having an SAP HANA on premise environment, together with Snowflake in the cloud as well as some flat files which you want to monetize as Visualizations via Salesforce is absolutely possible and something the market already started doing.

    As this use case might sound way beyond what you’re trying to do in step 1 let me underline that embedding Tableau into Salesforce internally is even more common. Use cases for it are limitless. Your users might benefit from seeing:

    • dashboards within the context of single accounts in order to see the life time spent of a customer
    • predicted next best actions
    • products which the customer might need based on buying patterns of others
    • the history of decreasing support tickets over time
    • deals which you might want to bundle
    • customers which you should focus on next
    • the success of marketing initiatives
    • marketing initiatives which you should promote
    • triggering actions outside of Tableau/Salesforce directly from within a dashboard
      (placing an order, buying/selling stocks, open up a ticket, calling a REST endpoint, etc…)


    Tableau internally embeds Tableau Dashboards into different contexts of Salesforce for all kinds of different roles (Sales, Marketing, Support, HR, …) ever since. From a technology perspective it is way easier than ever! When you’re using the same SAML provider for Salesforce and Tableau, you’re basically ready to go. You might want to check out the Tableau Viz Lightning Web Component for Salesforce which allows you to embed (integrate) Tableau visualizations right into Salesforce pages without the need to write HTML or JavaScript:

    Independent from HOW you’re embedding Tableau into Salesforce you probably want to have Single Sign-On enabled as described above. A great colleague of mine – Alex Eskinasy – recently wrote a blog post about how to achieve this with Tableau Online + Salesforce. This includes a detailed step-by-step video which you can find here:

    How to configure Tableau Online SAML SSO with Salesforce Identity (and some key gotchas)

  • Tableau Extensibility Framework

    Tableau Extensibility Framework

    The first thing you should notice about this blog post is, that it has got a highly precise name “Tableau Wafer Extension”, but the word “Framework” attached to it. The reason is, this Tableau Extension solves a highly specific problem, but it can be leveraged to solve way more challenges!!! Therefore don’t look at it as a single highly specific Extension, but focus on the different modules and what they’re doing and think about your own scenarios where:

    • Using selected marks to trigger something outside of Tableau,
    • Generating images on-demand,
    • Visualizing images in a certain context,
    • Sending JSON data from your Extension to a WebService,
    • Calling a Python script from your Extension or
    • Writing enriched data back data into a database

     would be of value!


    How can I get it?


    Architecture

    High Level Architecture


    Demo

    Demo

    First 7minutes: Use Case Description + Wafer Extension Demo. The rest of the time is focusing on a Technical Deep Dive into it in order to let your tech-guys adjust it to your needs.


    System Requirements:

      • Tableau Desktop (2020.2 and higher)
      • Port 5000 needs to be open/free (Flask Webserver)
      • Postgres database v11 (v12 not yet supported as of post date)
        • Postgis installed
      • Python 3.8 mit Anaconda 
      • Admin rights


    Installation

    Step-by-Step Installation

    1. Setting up the database with Ludwig Ehlert’s Postgres 11 install-setup walkthrough
    2. Download this Github repostory 
      • with the Tableau Extension
      • the TREX manifest file which points to the Tableau Extension
      • The v2020.2 Tableau Workbook
      • Python file with Flask Webserver
    3. Extract somewhere on your machine where you’d like to run the WebServer from in the next step (Ready. Set. Go!)
    4. Install Python 3.8 with Anaconda (leverage this ENV file for all the library dependencies: wafer_ext_env)


    Ready. Set. Go!

    Ready. Set. Go!

    You can finally start your Flask WebServer which is part of the “json_io.py” script. For Windows open up Anaconda command line console as Administrator and type in the following commands (for Linux users: you know what you’re doing! 😉

    
    cd C:\<THE PATH WHERE YOU EXTRACTED THE WAFER EXTENSION TO>
    
    conda activate flask
    
    set FLASK_ENV=development
    
    python json_io.py
    Now you should be all set! So please open up the Tableau Workbook within the 7Zip file and repeat what you can find within the demo video section.


    Troubleshooting


    Troubleshooting

      • Open up the “json_io.py” within a text editor and adjust the rows underneath “#####DB info” so that they do exactly match with your database setup.
      • If you run into issues please try to change the locale settings of the laptop you’re running the Tableau Workbook on to English (United States)
      • Make sure port 5000 is free
      • Check the logs within the Anaconda console
        • If you’re encountering a “ValueError: could not convert string to float:” within Anaconda’s debugging console simply change your workbook locale in Tableau Desktop to “English (United States)”
      • Debug the Tableau Extension similar to how I demonstrated it within this video:
      • With these steps in mind, please ask questions within the commenting area underneath if you’re having other issues in getting the Extension up and running


  • Embedding Tableau Responsively

    Embedding Tableau Responsively

    There are different ways on how to embed Tableau in a responsive way. This post references a page where you can see a couple of different examples on how to embed Tableau responsively. All of the examples might have pros and cons which you can discuss and compare with your Tableau contacts as well as your internal and external stakeholders. Some of them can also be mixed and matched like always showing a static preview image which you can get via Tableau’s REST API prior to have the interactive version ready for interaction.

    Keep in mind that an average user rarely changes their browser window size! Therefore make sure that you’re not over developing things in your own application. Even if it demos really nicely if a dashboard adjusts while making changes to the browser window – to me the most important thing is that a dashboard fits nicely into the screen where I’m opening it up.

    One last personal hint from my side. You’ll see that I’m just focusing on phone and desktop layouts. Why? I highly advise my customers to reduce the amount of content on dashboards. Therefore if a dashboard doesn’t automatically fit into an iPad by default, it probably has too much content on it and it needs to be simplified/split into a master-detail-dashboard or similar approaches.

    Without further ado please access, watch, download and customize the examples to make them fit your own needs. Please feel free to leave questions, comments and feelings below the post in order to let me optimize the content over time if this helps others to jump start their own responsive embedding project.

    Are you interested in more Embedded Examples? Find more by clicking on the image below:

  • Show Empty Rows and Columns

    Show Empty Rows and Columns

    Dear Tableaufans,

    data analysis is often about “What is IN the data?”. Therefore we sometimes forget to ask the question about “What is NOT in the data?“!!! There is a very easy feature within Tableau which enables you to do so. Showing all values of a dimension  even if there is NO data (NULL) attached to it!

    Just navigate yourself to Analysis Table Layout Show Empty Columns/Rows at the top of your screen.

    With that said – MERRY CHRISTMAS to the DataFam and all Trailblazers!!!

    P.S. This feature seems to be secretly released in 2018.3 😉


  • How to get started with embedding Tableau?

    How to get started with embedding Tableau?

    5 Step Quick Start Guide

    Get to learn how to embed Tableau vizualizations with the JavaScript API

    Demo Examples

    Great examples to see what’s possible as well as the code so that you can go ahead and download it to make it your own!

    The image shows a gallery of Tableau Javascript API / Embedding API examples. Feel free to download and customize them to your very own needs. The dashboards can be downloaded on Tableau Public, too.

    Tableau Conference Session

    Jackson Huang (Senior Software Developer at Tableau) and I have been presenting on Kickstart Your JavaScript Skills and Fuel Your Creativity with Awesome Embedding Projects at Tableau Conference. The number one link we’ve been sharing with the audience was the one in the first tab “5 Step Quick Start Guide”.

    The session kickstarted peoples Tableau JavaScript API skills by:

    • Demonstrating the very first steps of embedding Tableau into your own web application
    • Jumping right up to an intermediate level example by making visualizations interact with your existing apps
    • Equipping you with some commonly asked code snippets to unlock even more use cases with Tableau’s JS API (as you might have thought of)
    • And inspire you with a bunch of very creative JavaScript API examples which you can download right after the session!


    All of the content was based on real customer examples who monetize their data by visualizing data in Tableau and extending its capabilities by leveraging our JavaScript API! The slides of the session can be found HERE.

  • Write Back Extensions – 3 in 1 Quickstart

    Write Back Extensions – 3 in 1 Quickstart

    In this blog post you can get all 3 Tableau Write Back Extensions as part of a larger demo asset – a Tableau Server Site which demonstrates all kinds of cool things on the Tableau Platform. Nevertheless people are regularly asking how to just quickly demonstrate how Tableau Write Back capabilities can look like. So this blog post is just about how to get the 3 Tableau Workbooks from above which include (Write Back Extensions) up and running as fast as possible?!

    How can I get it?

    Demo

    Demo

    System Requirements:

    • Windows operating system
    • Port 8888  needs to be open/free (Webserver)
    • Port 3306 needs to be open/free (MySQL)
    • Tableau Server 2018.3 or above


    Step-by-Step Installation

    Step-by-Step Installation

      1. Download this customized XAMPP 
        • Port 8888  needs to be open & free (Webserver)
        • Port 3306 needs to be open & free (MySQL)
      2. Extract it into C:
      3. Start the xampp_start.exe within C:\xampp-tableaufans
      4. Download and open the Tableau Workbooks
      5. Database password is “admin

    Troubleshooting

    • Troubleshooting

      • Port 8888  is already in use before starting Xampp
        (Change the port)
      • Port 3306 is already in use before starting Xampp
        (Change the port)
      • You’re using an older Tableau Version than 2018.3.x
        • Download and install Tableau Desktop 2018.3.x or above
        • Open up the workbooks from step 4
        • Go to File > Export As and select the version that you want to downgrade to  
        • Keep in mind that the version needs to support Tableau Extensions. Therefore 2018.2 or above is required


      • If it’s still not working see how you can debug Tableau Extensions generally

        Files from the Video:
        1. Download Chromium
        2. Start Tableau Desktop 2018.3 (with Extension in Debug Mode)

    FYI

    P.S. Database User/Password are both “admin/admin” for all examples where workbooks leverage the MySQL database on Xampp you’ve been downloading above. You can have a look at the tables being used via http://localhost:8888/phpmyadmin/db_structure.php?server=1&db=tableaufans


    Please let us know if this has been helpful and what kind of scenarios you’re looking forward to solve with it.

    TREX Files


  • Row-Level Security with Initial SQL

    Row-Level Security with Initial SQL

    How to replicate this in your own environment?

    1. Create a free test account on Microsoft Azure
    2. Create a SQL Database on Azure
    3. Install Microsoft SQL Server Management Studio
    4. Follow the instructions on Manoj’s great blog post to:
      1. Create 3 users on the database
      2. Create a new table
      3. Fill the table with content
      4. Setup row-level security on the content
    5. Create the 3 users of step 4.1 on your Tableau Server
    6. Open Tableau Desktop and connect as one of these 3 users to the table you’ve been creating
    7. Create an initial SQL statement like this 
      EXECUTE AS USER = [TableauServerUser] WITH NO REVERT;
    8. Publish the data source – DONE! 😉


    @Manoj: Thank you very much for your blog post around how to setup Row-Level Security on Microsoft SQL Server! You made it very easy to understand the process of setting it up!

  • Custom Landing Page

    Back in 2017 I’ve been posting about how to define a start page for individuals, groups, sites or all users of a Tableau Server. Back in the day’s this has been more of a hack than a feature, but is has been already possible. In Tableau’s current 2019.2 beta it looks like that this hack is not needed anymore. The screenshot below demonstrates how administrators will get the ability to set the start page for

    • Theirselves (has been possible for all users since quite a while)
    • For all users of a particular site or
    • For all server users

     Please comment below if this will make your administrator life easier and if there are still things you’d love to see in the product as well.

  • Tableau Write Back Extensions

    Tableau Write Back Extensions

    Are you interested in trying the following 3 Tableau Extensions in your own environment?

    • If so, please follow the instructions from this blog post as it contains all 3 of them + much more as a Tableau Server Site which your can import 
    • Or this blog post if you want to get them up and running in just a few minutes 😉


  • Advanced Analytics

    Advanced Analytics

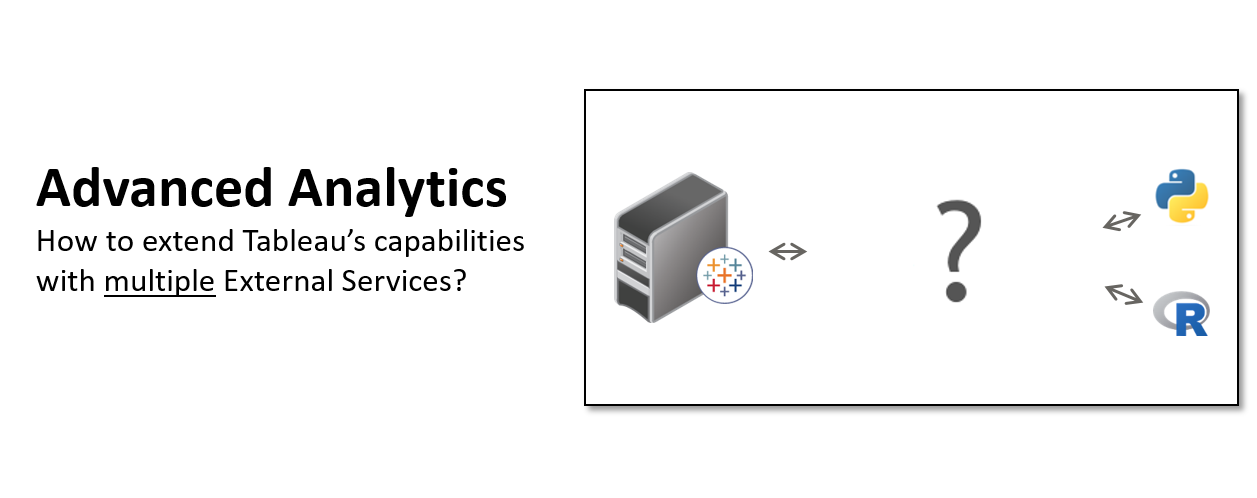
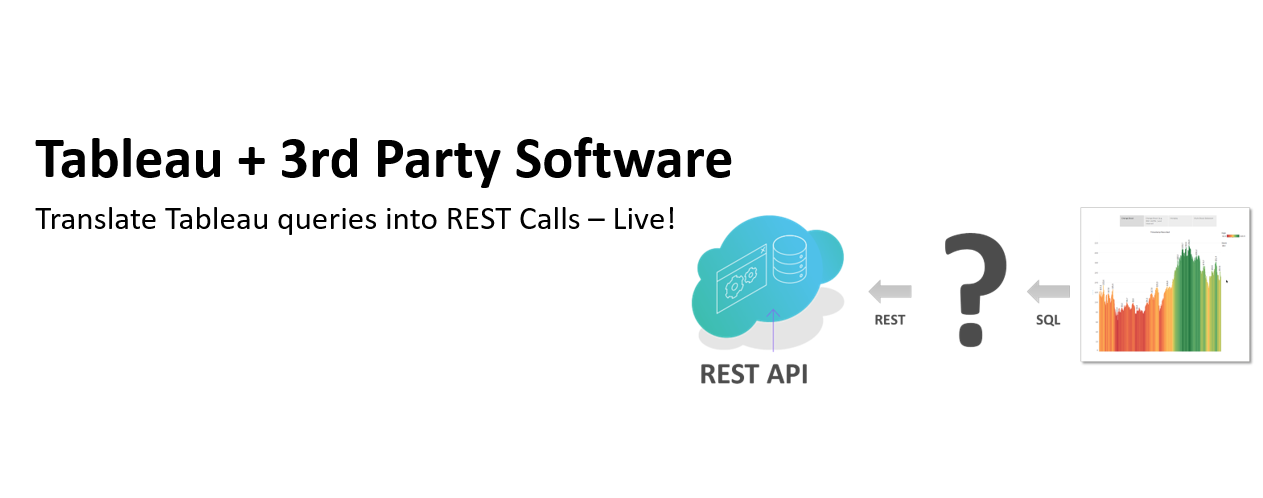
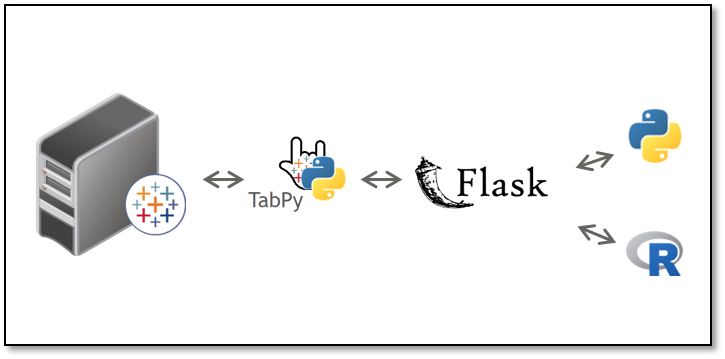
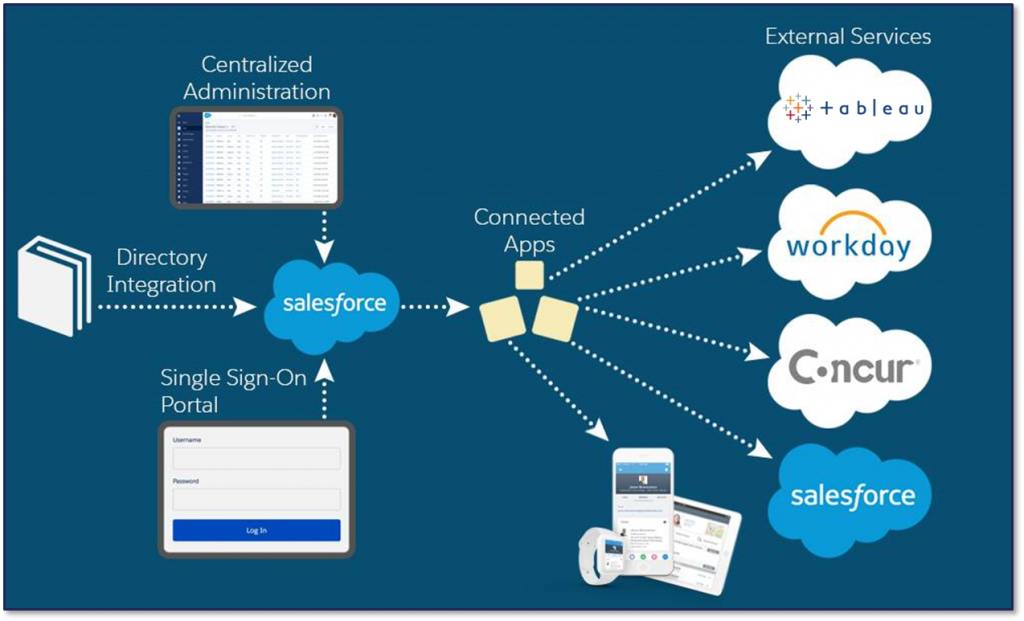
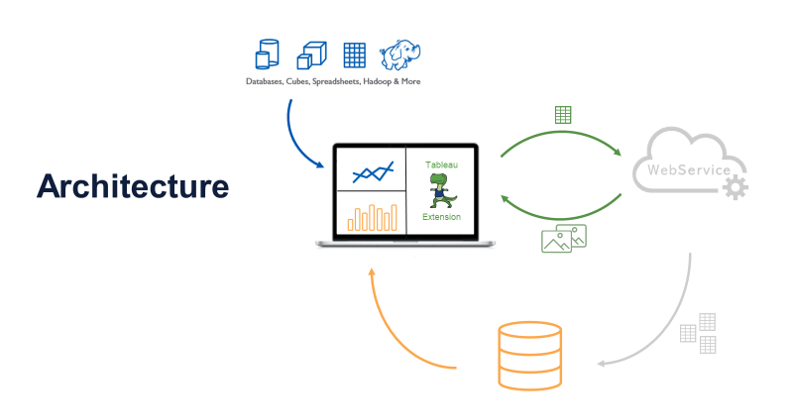
    A very popular post for the many data scientists within the Tableau community has been this blog post around how to setup multiple External Services for Tableau. Therefore this post is meant to be the first follow up post on it. While the initial architectural diagram showed flask as an adapter between TabPy and R as well as Python, Alican Polat slightly adjusted this architecture. Now TabPy acts as a pure web service which routes the traffic to 2 other services in this case Flask or DeployR:

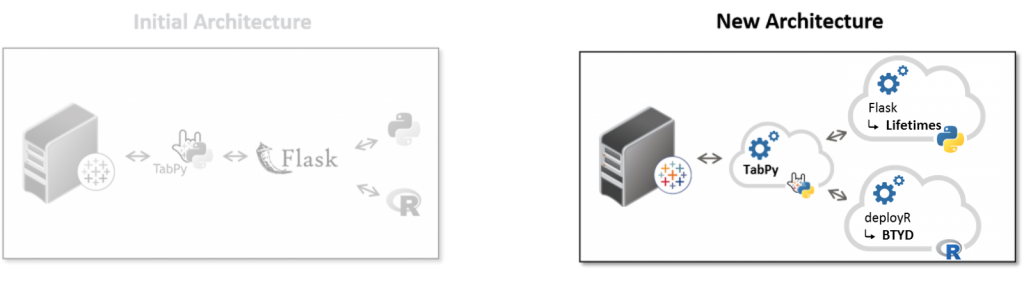
    • Flask (a web framework for Python) &
    • DeployR (allows you to expose R as an analytical web service)


    There are several ways on how you can decide which oh the 2 paths to follow along. One way could be a naming convention for your functions. So if your calculated field calls a function called R_GET_CUSTOMER_CHURNTabPy could decide to forward this web service call down to deployR. On the other hand side the same request could be processed by Python if the receiving web service call within TabPy would process a prefix “P” for Python so that the request P_GET_CUSTOMER_CHURN gets routed to the top right according to the illustration above. You just need to deploy a function within TabPy in order to make this decision! This could be a prefix which you process within an if-then-else statement, a suffix, time of the day, Tableau parameter…

    There is an infinite number of ways on how to decide whether to choose R or Python for the function call. So I just want to demonstrate one more way which would allow the end user to choose between on or the other. The 2nd and last code snipped in this post demonstrates an example which routes the traffic to either a Python or R based on a Tableau string parameter called “service”. It’s values could be predefined to R or PYTHON and set by the front end user of the dashboard. Of course it’s up to the administrator if individuals should have the power of choosing between one or another or if simply the creator of the dashboard should decide it based on the best library per use case.

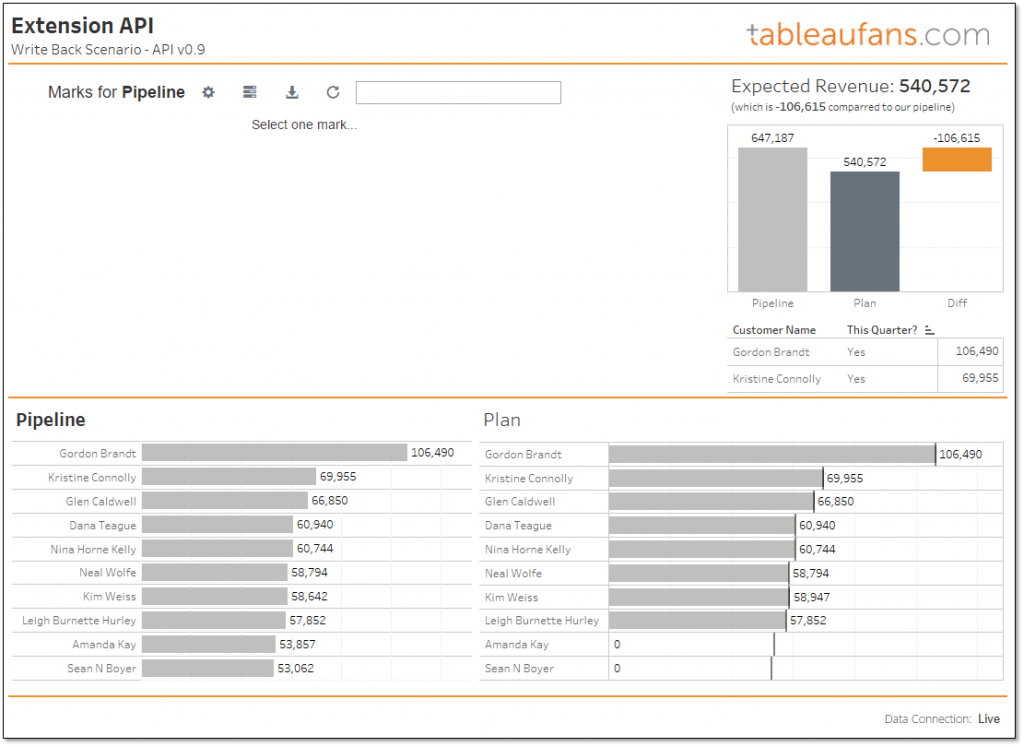
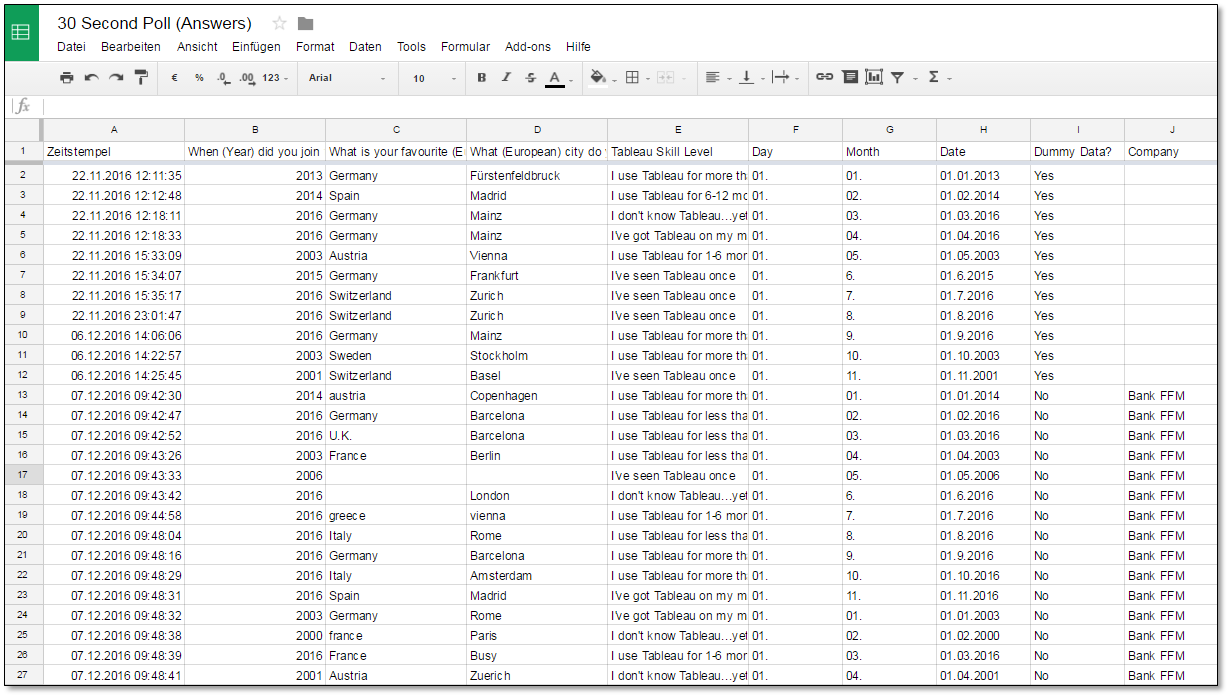
    So let’s say you’ve already setup TabPy according to GitHub or this German tutorial from Alexander Loth you go ahead and create a calculated field within Tableau. An easy first example to test if you’re getting back a result from TabPy would be:

    SCRIPT_REAL(' 
        import numpy as np 
        return np.corrcoef(_arg1,_arg2)[0,1]
    ', 
    SUM([Sales]), SUM([Profit]) )


    Once this works you can move on by setting up:

    • Lifetimes“, a Python library (which you embed into Flask) to calculate Customer Lifetime Values  and
    • BTYD“, an R implementation of it (on DeployR)


    Within both – R and Python – you can then setup customer churn models. Alican in particular calculates within his models:

    • How likely is it that a customer will continue to buy?
    • How likely is it that a customer is going to buy a certain product?


    On TabPy you need to define a function like the following one where a Tableau string parameter defines if R or Python is going to process the function you’re calling within a calculated field. In this example Python would be installed on the very same machine (localhost:8888) whereas the R service would be forwarded to a different host called myRserver with port 9090.

    def get_customer_product_churn(customer, product, days, service):
        import requests
        if service = ‘PYTHON’
        r = requests.post('http://localhost:8888/lifetime_service', data = {
                                                                            'customer': customer,
                                                                            'product': product,
                                                                            'days': days,})
        if service = ‘R’
        r = requests.post('http://myRserver:9090/lifetime_service_withR', data = {
                                                                            'customer': customer,
                                                                            'product': product,
                                                                            'days': days,})
       
    
        serviceResult = r.json()
        return serviceResult['result']


    I hope this post answers some of the burning questions you – the community – had. Please provide us with any kind of feedback below. I promise it hasn’t been the last blog post around advanced analytics, Python and R! 😉

  • Interactive Company Reports

    Interactive Company Reports


    In 2014 I’ve been blogging about “Interactive Company Reports” for the first time. The initial post is just available in German, but the links and ideas will quickly be reiterated in this post. 

    Moritz Pawelke (after working at Deloitte as Director | Digital & Analytics @ Financial Advisory he is now working as Head of Consulting at M2 – a Tableau Partner) had this idea of making company reports more interesting by providing people an interactive version of it online. This massively extends the reach of a publication and you can way better review what people find interesting! In order to provide people the ability to jump from a first static impression to an interactive one (being able to filter to the user’s needs) you can easily provide people with QR-codes directly within your report. My visual example of it back in the days was the picture on the right which got adopted quite soon.

    An IT-Service company based out of India called Wipro created an appealing interactive report as part of a survey in 2013:

    A little bit later Moritz Pawelke and myself got introduced to each other. We put our heads together for KPMG’s first interactive version of their biggest annual survey which just got published as PDF and printed versions back then. The work resulted in an interactive version of KPMG’s Global Automotive Executive Survey. This has been a great success and it leveraged Tableau Data Stories just great! If you’re searching for impressions for nice color codings I can highly recommend you to look at 2016th Tableau Data Story:


    This year Dieter Becker Global & EMA Head Automotive Practice and Aline Dodd Global Executive for Automotive slightly changed the approach on how they’ve published the report. So rather than staying with an interactive Data Story they’ve leveraged similar web techniques I’ve been using for my initial demo post. Now you can navigate between different dashboards on their web app depending on your interests. Nice animations makes this visually very appealing. In order to get this year’s report out there we thank Florian Ramseger, Katie Mertens, Olga Kolcheva and Konstantin Greger for their great work!

    So feel free to get inspired by the interactively version here.


  • How to write back data to Microsoft SQL Server, MySQL or SAP HANA?

    How to write back data to Microsoft SQL Server, MySQL or SAP HANA?

    Last year in March I’ve been posting an extension which allowed Tableau end users to write back data directly from within a dashboard. Back in the days Tableau Extensions have been available in BETA only. Today – roughly 12 month later – 2 Tableau ROCKSTARS joined me on Tableaufans.com and shared their modified versions of the original extension. Therefore I’m happy to announce that you can now simply start to setup the extension you can see in the video below by:


    1. Must: Follow the instructions from the initial blog post
    2. Optional:Modify the Extension files from above to either

      a) Adjust files to write data back to Microsoft SQL Server

      b) Adjust files to write data back to SAP HANA

    You’re good to go. If you are interested in commenting single data points like outliers and having a conversation around them rather than commenting a whole dashboard find this Tableaufans Commenting Extension

    Other than that we’re always looking for feedback. So please give us an idea how helpful this blog post has been by leaving us a short comment below. Thanks a lot, Timo.


  • Tableau Commenting Extension

    Tableau Commenting Extension

    Which problem does it solve?
    It solves the problem of having discussions around particular outliers in visualizations. You can basically select any mark on a dashboard, create a new comment for it and review what other people discussed about it. This particular Tableau Extension is commenting on Order IDs, but you can easily adjust it to comment on mark you want!


    How does this look like? 

    How can I get it? 

    Step-by-Step

    Step-by-Step Installation

    1. Extract both Extensions into “My Tableau Repository/Extension”
      Download Extensions here
    2. Extract Xampp (Webserver + MySQL directly into your C: drive)
      Download Xampp here
    3. Start C:/xampp/xampp_start.exe as administrator
    4. Start Tableau Desktop 2018.3.x or a higher version and open up one of the following workbook
      Download Workbooks here


    Video Installation

    Video Installation


    Troubleshooting

    Troubleshooting

    • Port 8888  is already in use before starting Xampp
      (Change the port)
    • Port 3306 is already in use before starting Xampp
      (Change the port)
    • You’re using an older Tableau Version than 2018.3.x
      • Download and install Tableau Desktop 2018.3.x or above
      • Open up the workbooks from step 4
      • Go to File > Export As and select the version that you want to downgrade to  
      • Keep in mind that the version needs to support Tableau Extensions. Therefore 2018.2 or above is required


    • If it’s still not working see how you can debug Tableau Extensions generally

      Files from the Video:
      1. Download Chromium
      2. Start Tableau Desktop 2018.3 (with Extension in Debug Mode)


  • How to get started to integrate Tableau into your own software solution?

    How to get started to integrate Tableau into your own software solution?

    Which problem does it solve?
    It solves the problem of finding the right information you need in order to embed Tableau into your own app/application/webpage/wiki/etc.


    How to? 

    1. Install Tableau Server or Start a Tableau Online Trial

    2. Navigate to one of the Sample Dashboards

    3. Integrate this into your application/web page. It’s as easy as putting a Youtube video into a blog

    4. Integrate the same Viz into your application/web page,just more flexible by leveraging Tableau’s JS API

    5. Make it Look YOURS by formatting the Viz according to your corporate look and feel


  • How to save Excel files while Tableau is open?

    How to save Excel files while Tableau is open?


    Which problem does it solve?

    Not being able to change Excel files (e.g. in planning scenarios) while you’re analyzing the very same file within Tableau.


    How to? 


    Links from within the video?

    All Tableau Drivers
    Microsoft Access Driver (for 2018.2)
  • Tableau Conference – Fun Session about Embedding Tableau

    Tableau Conference – Fun Session about Embedding Tableau

    Dear Tableaufans, are you ready for Tableau Conference in New Orleans? Jackson Huang and myself – Timo Tautenhahn – are going to have another FUN SESSION about embedding Tableau into your own apps called: “

    Tableau JavaScript API | The most delicious ingredient for your custom applications

    This session will jumpstart your Tableau JavaScript API skills with a live demo, it will show how other clients are leveraging it as well as some inspirational demos on “What else is possible with Tableau’s JS API”! We’d love to welcome you in one of our session this week!

  • Internet of Things

    Internet of Things


    As the term Internet of Things (IoT) is climbing up on many “hype cycle hills” more and more companies are starting to leverage the data each and every device is creating. By being involved in helping start-ups, medium-sized and enterprise companies to making sense out of their IoT data you can definitely see that a lot of requirements in this area are very similar! Even if the device types, data volumes, back-end systems as well as the distribution of the knowledge gathered within the analysis can vary a lot – certain aspects are being asked all the time!

    This very short blog post initiates a new category called IoT. It deals with some of the most frequently asked questions in this area. Today I want to share a workbook as an output of a meeting with an enterprise client this morning where we’ve answered the following questions in a visual way right during the their asks:

    • How to plot normal distributions?
    • How to deal with zooming, highlighting and filtering?
    • How can custom parameters help in this context?
    • How to figure out the amount of data being analyzed within and outside of a defined range?
    • Hot to create reference lines and bands?
    • How to setup reference bands on histograms (bins)?
      (Simply convert your “Bin” from Discrete (Blue) to Continuous (Green) )


    As you can’t answer every question with one sentence I’m going to share the workbook created below. I hope by playing around with the parameters on the dashboard you get inspired to integrate them in your dashboards, too! 😉

    Do you want to get the workbook? Simply click on the picture below! 🙂


  • Tableau Extension API – Write Back – Updated Source Code for Tableau 2018.2

    Tableau Extension API – Write Back – Updated Source Code for Tableau 2018.2


    LATEST VERSION OF THIS WRITE BACK EXTENSION => CLICK HERE


    Due to the Google Analytics analysis I’ve done for the current quarter one can easily see that you – the Tableau community which we call “Tableaufans” – have been asking for more write back content. Would you agree?

    So as a very first step I’m going to attach a quick tutorial around how to get “Tableaufans-WriteBack-2018.2” up and running for Tableau’s latest release (2018.2) and above. If you haven’t heard about “Tableaufans.com’s Write Back Extension” yet, you might want to watch the ~4min video from one of the previous posts to understand what you could get by following these steps.

    1. In order to be able to leverage the write back extension you need to have a webserver and a MySQL database
      1. I’m using XAMPP version 7.0.23 which contains both. You can download it here.
      2. Once you’re done downloading it you can extract the folder directly into C:
        (By copying it directly into C: it would simply allow you to follow all of my tutorials around extensions and JS API just a little bit easier in the future.)
      3. Start “C:\xampp\xampp_start.exe” as administrator
    2. Download the latest extension-api-master here: https://github.com/tableau/extensions-api
    3. Extract the content and paste it into your webserver (C:\xampp\htdocs)
    4. Extract the zip below and create a new file path where you extract it’s content into:
      Tableaufans-WriteBack-2018.2.ServerLogic(HTML,PHP,JS,CSS,)
    5. Extract the *.trex file and copy it into C:\Users\<USERNAME>\Documents\My Tableau Repository\Extensions
      Tableaufans-WriteBack-2018.2
    6. Make sure your XAMPP (Webserver+MySQL database) is up and running
      1. Apache should use port 8888
      2. Mysql 3306
        -> (If this is not the case, please change your ports accordingly as it will help you to use more assets from Tableaufans.com in the near future)
    1. MySQL should have a database called ‘yoursqldb’ with a table ‘getdataandwriteback’:
      (if not, please use ‘yoursqldb.sql’ attached to create the table within a database called ‘yoursqldb’)
    2. Add a new user to MySql (direct link to the right user interface on MySql)
      1. User name: admin
      2. Host name: localhost
      3. Password: admin
      4. Re-type: admin
      5. Privileges: Data, Structure & Administration
    3. Extract and Open “Tableaufans-WriteBack-2018.2.twbx.zip” with Tableau Desktop
    4. Drag and drop extension into the canvas and choose the one you copied into C:\Users\<USERNAME>\Documents\My Tableau Repository\Extensions
    5. Allow data access to the extension:
    6. Choose “Pipeline” as sheet to choose data selections from:
    7. Happy write back your data 😉


    Troubleshooting:

    • If the data doesn’t get written into the database make sure that you’ve got a user called “admin” in MySQL with password “admin” with the following permissions:
      • http://localhost:8888/phpmyadmin/server_privileges.php?db=&viewing_mode=server
      • http://localhost:8888/phpmyadmin/server_privileges.php?username=admin&hostname=localhost&dbname=&tablename=&routinename=
    • If you want to debug Tableau Extensions generally you might want to have a look the following 2:21 min tutorial

      Start Tableau Desktop (with Extension in Debug Mode).bat
    • If you’re having any troubles in getting the extension up and running please leave us a comment below.
  • Tableau Server – How to see who deleted a workbook?

    Tableau Server – How to see who deleted a workbook?

    Which problem does it solve?
    To figure out why content doesn’t show up anymore. Did a user delete it? Has it been a Tableau Server administrator job (REST API / TabCmd)?

    Can I use this for my Tableau Server environment?
    Yes, if you’ve got access to the Tableau Server repository on Postgres.

    How to? 

    SQL Statement from within the video?
    SELECT ‘User named: ‘ || a.name || ‘, Deleted workbook: ‘|| b.name as WhoDidIt
    FROM historical_events c,
    hist_users a,
    hist_workbooks b
    where c.historical_event_type_id in
    (select type_id from historical_event_types
    where name = ‘Delete Workbook’)
    and c.created_at > (now() – interval ’24 hour’)
    and c.hist_workbook_id = b.id
    and c.hist_actor_user_id = a.id

    Links from within the video?
    Jeff Krieg’s original post: https://community.tableau.com/message/433508#433508
    How to enable the “readonly” user: Tableau Server Documentation

  • TabCompare – Comparing Tableau Server Views

    TabCompare – Comparing Tableau Server Views

    In large Tableau Server installations you can have a tremendous amount of workbooks. As migrations with Tableau Server are historically already very easy many companies are just looking at some of the most popular workbooks to see if the upgrade has been successfull. Nevertheless the amount of these popular workbooks can grow over time and you might want to automate this last mile with TabCompare.

    So if you want to know more about where to get it from and how to use it, I highly recommend you to read the blog post of a good friend of mine – Alex Ross! He’s the unofficial Mr Web Data Connector! The only reason why he’s not a Tableau Zen Master is that he’s actually working for Tableau! 😉

    Without further ado:

    TabCompare: Automated Content QA For Tableau Server Upgrades


  • Tableau Photo Booth

    Tableau Photo Booth

    What is it?
    It’s a web application which visualizes pictures coming from a 3rd party application (Photo Booth) based on selections end users are making on a map (Tableau Dashboard).


    Which problem does it solve?
    It solves the problem of combining Tableau + pictures when you can’t leverage URL-Actions or custom shapes.


    How to use it (End User Tutorial): 


    Can I use this for my internal Tableau Event?

    Sure, just ask your Tableau contact if a consultant can set it up on a Tableau owned laptop. He or she can download XAMPP+TABLEAU PHOTO BOOTH here and when you asked some days in advance you could be lucky and have a Tableau Photo Booth up and running on-site 🙂 Another way of getting it is download it by your own and simply follow the installation instructions below.


    What is it technically?
    It is an application which uses an

    • Apache Tomcat -> As a web server to host the HTML, CSS and JS code
    • MySQL database -> to store data users are submitting
    • Tableau JavaScript API -> to immediately visualize input users are making


    How can I get it?

    Step-by-Step Installation

    Step-by-Step Installation

    1. Download the code from above (XAMPP+TABLEAU PHOTO BOOTH here)
    2. Extract 7-Zip-File into C:\
    3. MAKE SURE PORT 8888 is not in use by another application on your machine
      (Tomcat is configured to use it)
    4. MAKE SURE PORT 3306 is not in use by another application on your machine
      (MySQL is configured to use it)
    5. Start “xampp_start.exe” on C:\xampp as an admin!
    6. Navigate to “C:\xampp\htdocs\TableaufansPhotoBooth” and publish “TableaufansPhotoBooth.twbx” with Tableau Desktop 2018.1 or above
      (when you don’t want to change the embed code simply publish it to your local Tableau Server http://localhost into the “Default” project
    7. Open up “http://localhost:8888/TableaufansPhotoBooth/” within your browser and press F11 (full screen)

    Video Installation

    Video Installation

  • How to connect Tableau to REST APIs – LIVE?

    How to connect Tableau to REST APIs – LIVE?

    The following video is demonstrating how you can connect Tableau to a REST API – LIVE – by making use of a 3rd party software (which needs to be licensed!). It is called Custom Connector SDK from Progress. It’s an SDK which you can think of as a framework which you can adjust to your REST API. Before I’m going to show how to leverage OpenAcess together with Tableau. I’m going to explain how the architectural flow looks like. The demo will then leverage a REST API which contains stock data.

    Ressources/Call to Action:


    Special thanks to the whole Progress team! Great attitude, very responsive and I really enjoyed a great webinar with you guys today! Thank you Sumit Sarkar, Saikrishna Bobba, Nishanth Kadiyala, Dennis Bennett, Dennis Bennett, Dipak Patel, Petya Popova-Chilikova, Michael Burritt, Kim Bears and John Fremer! Looking forward to more great customer cases in the future!

  • Tableau Extension API – Write Back – Source Code

    Tableau Extension API – Write Back – Source Code


    LATEST VERSION OF THIS WRITE BACK EXTENSION => CLICK HERE


    Due to the positive feedback of the write back extension from the video below I want to equip IT FOLKS with the right tools to setup the same environment on their machines for POC kind of situations as fast as possible. Please be aware of the fact that I might be referencing absolute paths in the code which means in order to be up and running as fast as possible you might want to copy the code to the exact same folder I did (C:)

    Download and unzip this content: writeBackV1.3(incl XAMPP and MySQL DB)

    1. Install – tableau-setup-std-main.18.0208.2310-x64.exe
    2. Copy “WriteBackV1.3.trex” into “Extensions” within your “MyDocuments” folder
    3. Extract xampp directly into your C: drive
    4. Start XAMPP – Apache MySql and Tomcat
    5. Start the “05 Start this BAT – Start Tableau Main (with Extension in Debug Mode).bat”
    6. Open this workbook in exactly the instance from above – Extension API – Write Back v1.3.twbx
    7. Open Chromium (exact same version as provided in the pre-release webpage) – To Remote Debug your Extension


    Optional:

    Cheers,
    TT

  • Tableau Extension API – Write Back

    Tableau Extension API – Write Back

    LATEST VERSION OF THIS WRITE BACK EXTENSION => CLICK HERE


    The video below is demonstrating how you could leverage Tableau’s Extension API to save a tremendous amount of time in your planning and forecasting processes. This is done by coding a Tableau Extension which is actually writing back data into your transactional database (e.g. CRM system) directly from within a Tableau Dashboard!

    I’m looking forward to get your feedback on it!
    Cheers,
    TT


    P.S. Interested in the workbook? Here you go: Interested in the Extension? Let me know 😉

  • Tableau + SAP BW

    Tableau + SAP BW

    Do you want to combine different SAP BW Queries on a single Tableau Dashboard? Well, having multiple next to each other on a dashboard is not a problem at all, but how can you make them interact with each other? This is exactly what this blog post is going to demonstrate:

    • If you’re working on a single SAP BW Query and you want to filter from one sheet to another you can do this in the the exact same way you’re used to use relational data sources (Use Sheet as Filter)
    • If you’re using 2 different SAP BW Queries, filtering from one to another get’s a little bit more “tricky”
    • The following video shows you how to interact with multiple SAP BW Queries on a Single Tableau Dashboard.


    1. Option: Normal Action Filter
    This works if both Queries are using the same unique remote name (Tableau terminology; Right click on a dimension within the Data Pane in Tableau Desktop -> Describe Field)
    e.g: [0D_NW_CNTRY].[0D_NW_CNTRY].[LEVEL01]

    2. Option: URL Action
    The problem here is that this will open up a new tab if you don’t follow a “workaround” like:  Opening dashboard links in same browser window

    3. Option: URL Action + Web Page Object
    This is my preferred solution so feel free to directly jump to min 3:35 of the tutorial video above


    Download the workbook here:
    Tableau + SAP BW (Filter options on 2 seperated Queries)
    (The ZIP file does just contain the *.twb file. I was trying to use SAP BW sample queries only. I’m interested to hear if they work for everyone once you’ve changed

    • TABLEAUSERVER to your <YOUR TABLEAU SERVER URL> and
    • the SAP BW connection to your testing environment


    Cheers,
    TT

  • Advanced Analytics

    Advanced Analytics

    Yesterday I’ve had a great meeting with Alican Polat. Alican has got roughly 20 years of experience in the analytics industry!!! The spectrum he covers in this area reaches from architectural design, over SAP, Tableau and other BI front end as well as backend tools, too machine learning algorithms!

    Today I’d love to quickly share an architectural design he came up with throughout this year. As a machine-learning enthusiast, he likes to code R and Python code at the same time. “Depending on the use case there are libraries out there which sometimes are faster in R and other times in Python” he says.

    Based on Tableau’s documentation one could think that you can just use a single External Service like Python and R. The truth is, you can leverage both at the same time if you’re leveraging Alican’s architecture:

    He set up TabPy to communicate with Tableau Server. TabPy is routing every R and Python function to Flask, which simply acts as a proxy. Based on a rules (e.g. naming conventions) Flask decides where to route the request to either R or Python before the result set does get send back to Tableau Server. 

    Side note:

    • Matlab is not used in their current environment and would be interesting to see if Flask could route requests to Matlab, too
    • Julia (=”high-level, high-performance dynamic programming language for numerical computing”) could might be added to this architecture like Alexander Loth describes in his blog post


    If you like this approach please leave a comment below and Alican Polat or myself will make a follow up post with more details about it.

  • Tableau Server Hack – Custom Landing Page per User, Group, Site or Corporate Wide

    Tableau Server Hack – Custom Landing Page per User, Group, Site or Corporate Wide

    Are you a Tableau Admin? Do you want to define which Project/Workbook/Dashboard/DataStory users should initially see once they’re logged in?

    Since many customers are used to have entry dashboards for most of their applications to show latest news, maintenance windows, updates and changes to their end users.  Many Tableau customers are using Tableau dashboards to do the exact same thing. Oftentimes they also guide users to internal wikis, enablement material and most popular vizzes (visualizations/dashboards). Yesterday I have talked to a large enterprise customer who wanted to define this entry page per site. Because every site has its own news, updates and most popular vizzes. Therefore I loved the requirement and I came up with the solution you can have a look at within bellow’s video.

    You’ll see where Tableau Server stores custom Start Pages per user in its internal Postgres database (Repository). How to get access to it and how to modify the Start Page for a single user. If you want to adjust this for all users of a certain user group or site, you simply add this information to your SQL statement.

    Last but not least I need to make sure to let you know, that every manual change to Tableau’s internal Postgres database is 100% NOT SUPPORTED!!! Tableau may change these internal database structures in future releases, which could affect changes like this! This advice is similar for every software vendor: It is not recommended to manually change application databases! So what should you do if you have a similar requirement?

    1. Make a backup of your production environment!
    2. Load this backup into a non-production environments!
    3. Adjust the non-production repository as if you have seen it within the video and test it! (manually, Tabjolt, combination of both)
    4. Afterwards you can decide how to deal with the value VS the additional effort it takes in order to automate and test this procedure for future releases.

    Looking forward to hear your thoughts around it!

  • Client-Facing Analytics

    Client-Facing Analytics

    Today I want to follow up on my previous post about Customer Portals which I’m going to re-brand to “Client-Facing Analytics” where clients can be both internal AND external! The reason for the re-branding is to avoid confusion around Tableau’s “Customer Portal” and embedding Tableau Visualizations into applications/portals.

    With that said I’m going to introduce you to some really awesome material which our very own Kovner published on GitHub recently. It’s called Tableau Embedding PlaybookThis is a guide which contains the key ingredients as well as links and resources which help you to embedded Tableau into your own application.

    Kovner who works as a Product Manager for OEM at Tableau highlighted that this publication was a team effort which was initiated and mainly driven by Bryant Howell with Wes Schiesz and Alex Sigal with Gordon Rose! Well done folks! 🙂


  • Customer Portals

    Customer Portals

    Embedding Tableau Server or Tableau Online into customer portals is quite a very popular use case and more and more companies are providing Analytics to their clients. There are many ways of doing that and Tableau‘s Community is providing hundreds of great articles and videos around it.

    As I was on customer side in Switzerland this morning to actually talk about it I decided to create this tiny little blog post. It’s basically meant to demonstrate one very basic example of how such an integration can actually look like for an enduser.

    Basic Example for a Customer Portal with Tableau

  • Custom Tableau Demo in 15 Minutes

    Custom Tableau Demo in 15 Minutes

    Today I want to reference a post I made in March 2015. Back in the days I was recording a video about different ways to start a Tableau presentation. A couple of days ago I got invited to give a TechTalk speach at a bank in Frankfurt, Germany. In order to introduce the crowd to Tableau I wanted to do a custom demo. Therefore I was creating a simple Google Form which stores results in a Google Spreadsheet which Tableau can connect natively to since version 10.

    Questions
    The coolest way to demonstrate the power of Tableau should contain a time information (an exact date would be best!), something geographical and some interesting categories. In order to keep it as simple and fast as possible for the audience to answer my questions I was keeping it as easy as possible:

    Answers
    Answers get stored in a Google Spreadsheet. I was adding a couple of things to the default sheet like:      

    • Date: I was not allowed to ask the exact date when people did join the company. In order to demonstrate Tableau’s powerful TIME capabilities I was randomly adding days and months to the actual year when people joined the company
    • Dummy Data: If for whatever reasons people wouldn’t have been able to answer the questions – this would have been my backup data I produced upfront
    • Company: This column alows me to compare companies (anonymously) during future demos


    Outcome
    The best part starts once you take the data and turn it into something meaningful. You can either connect Tableau live to your Google Spreadsheet or simply copy and paste the data into Tableau (which oftentimes creates an even bigger WOW-EFFECT). Whatever you’re coming up with keep in mind that every single drag and drop is already demonstrating the power of Tableau! And while you’re asking questions while you’re already answering them you’ll learn a lot about your audience if you add something like “Tableau Skill Level / How long are you already using Tableau” to one of your questions! This will tell you if you can jump into more sophisticated topics within Tableau or not after you’re “TechTalk / Tableau Day KICKOFF Demo” 😉


    Last but not least please feel free to download the PowerPoint template with AWESOME TABLEAU COLLEAGUES jumping in the background and customize it to your needs (tons of URL + QR code creators are out there! 😉


    Tableaufans.com – PowerPoint Template – Jumping Tableau Colleagues


  • TabCmd – Automating Tasks

    TabCmd – Automating Tasks

    This video demonstrates how to move a workbook from one project to another project using TabCmd. The general idea of Tableau is to setup a highly agile Analytics Platform. Nevertheless some industries, companies or use cases require workflows/regulated approvals before a workbook, dashboard or report can be moved from a pre-production/sandbox environment to a corporate production environment.

    The following video you’re going to see is leveraging a simple batch script which can be used as a starting point for workflows and automization tasks like described above.

    Move from Production to Qualifying
    (download batch file from above’s video)

  • SwipeRight

    SwipeRight

    Our Tableau Conference in Austin just started and more than 12.000 customers made their way to Texas!

    Today I wanna post about a fun app which can be used in many different ways! It’s called “SwipeRight” and I’m more than happy to talk about it during as well as after my sessions “Hot. Dirty. Sets.” and “Customization and Embedding with the Javascript API” here in Austin.

    Please feel free to reach out to me via the “Data 16” App or simply by leaving a comment on this blog post. Enjoy the conference and I’m looking to talk to as many Tableaufans like you as possible!!!

    swiperight-test-v1-0

    P.S. Simply click on the picture to get to the small web app called SwipeRight.

  • Clustering – How to get ranges?

    Clustering – How to get ranges?

    This video demonstrates how to get the smallest and the largest value within each cluster:

    More detailed information on what happens within Tableau’s clustering algorithm can be found on Bora’s awesome blog post over here

    The official documentation can be found here

    Tableau Public Viz:

  • Conference materials as videos on-demand

    Conference materials as videos on-demand

    Tableau’s last Conference On-Tour is over now. After Sydney, Singapore, Paris, London and Munich Tableau set the stage for it’s biggest event this year – TC Austin. Many of you, who attended Tableau Conferences in the past are already aware of the fact that you can’t attend all the sessions you’d love to see! Therefore Tableau offers the ability to watch most of the content as videos on demand afterwards!

    So here we go, feel free to watch sessions you couldn’t attend: Session Recordings German

    Content which was presented either by customers or which got delivered as part of Hands-on-Trainings are not necessarily recorded as Tableau was mentioning in Munich. If you’re interested in the content in English please have a look at London’s post conference material: Session Recordings

    P.S.Due to the fact, that recordings can’t be a replacement for beeing at a Tableau conference in person. So the image of this blog post is related to the last blog post, but it will just make sense if you’ve been part of the presentation “Artilize This” in Munich physically 😉

  • Art and Analysis

    Art and Analysis

    You think the above picture does not make sense at all? Well, that’s not true! You just need to change color and sorting and you’ll figure out what’s within the bubble chart. To help you just a tiny little bit – here we go with the colors you’ll need to discover the unkown:

    Art and Analysis - The color you need to discover the unkown

    If you can’t figure it out without the data set you’re more than happy to join 1 out of 2 sessions about “Artilizing Data” at Tableau’s conference on Tour in Munich:

  • How to create a fancy rank evaluation viz?

    How to create a fancy rank evaluation viz?

    This is a quick tutorial as an iPhone optimized view on how to create something like this:


  • How to transform street data into geocodes

    How to transform street data into geocodes

    Today I want to share with you some ideas around transforming raw data into something more visual and valuable. The video below is demonstrating:

    1. Copying data containing street names from a PDF
    2. Pasting this into a free online tool (Batch Geocode) to get LAT and LONG
    3. Saving the result as a CSV
    4. Connecting Tableau with this CSV
      1. Setting the delimiter right
      2. Setting the text qualifier right
      3. Explain how to solve “.” and “,” issues when working with flat files
      4. How to leverage data source filters
    5. Plotting results on a map
    6. Extract information via SPLIT and RIGHT calculations
    7. Visual grouping
    8. Final interactive dashboard


    Links from within the video:

  • Dynamic Traffic Lights

    Dynamic Traffic Lights

    Today I want to share an idea about how to visualize targets. There are a bunch of different ways to do so. If the data is already part of your CRM solution or data warehouse – just take this information and represent it as bar, bullet graph, traffic light…you name it. If this is not the case you could go with a parameter which every salesperson in your company can use to actually change the target to the individual one. Now you might think…well, but I need to change this target each and every time one is opening the report. This is not the case! If you’ve got Tableau server in place you can easily save a “custom view” and making this your personal “default view” (for this report). This means each and every time “user A” is opening the report/dashboard, user A will see the target he has set last time. The same applies for everyone else.

    Next to the concept of parameters and how you can leverage them I’ve used a concept which is known as “proportional brushing”. This allows you to compare the performance of a region, salesperson, product, etc. against the overall performance. The example dashboard which you can open by clicking on the picture below is showing this over time. So how can you adopt this? Well just download the workbook and try to re-engineer it. You basically need to:


    1. Right click on your date –> Create –> Custom Date –> “Order Date (Month / Year)”
      • This creates a field which just contains month/year
    2. Create a calculated field –> “{ FIXED [Order Date (Month / Year)]: SUM([Sales])}”
      • Represents a Level Of Detail Expression (LOD) which fixes sales to this time dimension
    3. Create a dual axis chart which is containing sales and your calculated LOD
    4. Put this sheet as well as another sheet which works as a filter on a dashboard to see the individual performance compared to the overall performance
  • Tableau Data Story – KPMG GAES 2016

    Tableau Data Story – KPMG GAES 2016

    One year ago I was blogging about interactive company reports. Back in the days KPMG was publishing it’s Global Automotive Executive Survey 2015. Today I want to share the next level of it with you!

    Moritz Pawelke (Global Executive for Automotive at KPMG) himself did another amazing job by publishing this years survey! I highly recommend to have a look at it. Any comments, questions and feelings are highly welcome! Enjoy!

    Click here to get to the live version…