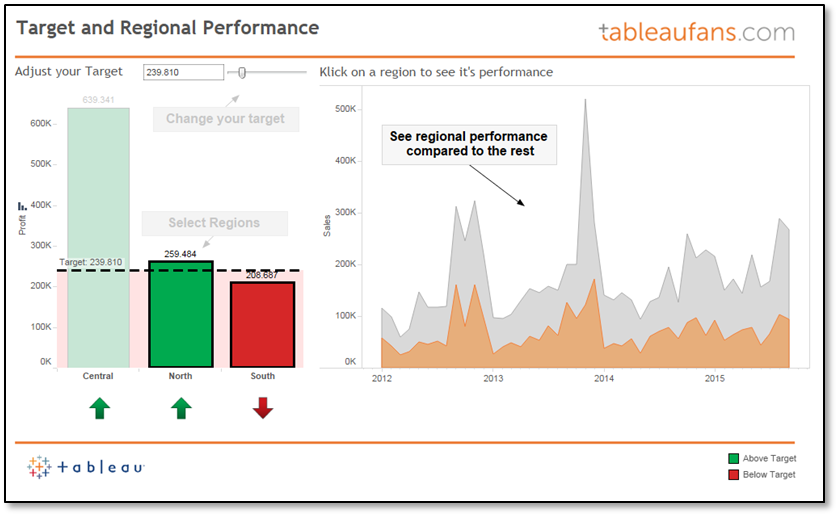
Today I want to share an idea about how to visualize targets. There are a bunch of different ways to do so. If the data is already part of your CRM solution or data warehouse – just take this information and represent it as bar, bullet graph, traffic light…you name it. If this is not the case you could go with a parameter which every salesperson in your company can use to actually change the target to the individual one. Now you might think…well, but I need to change this target each and every time one is opening the report. This is not the case! If you’ve got Tableau server in place you can easily save a “custom view” and making this your personal “default view” (for this report). This means each and every time “user A” is opening the report/dashboard, user A will see the target he has set last time. The same applies for everyone else.
Next to the concept of parameters and how you can leverage them I’ve used a concept which is known as “proportional brushing”. This allows you to compare the performance of a region, salesperson, product, etc. against the overall performance. The example dashboard which you can open by clicking on the picture below is showing this over time. So how can you adopt this? Well just download the workbook and try to re-engineer it. You basically need to:
- Right click on your date –> Create –> Custom Date –> “Order Date (Month / Year)”
- This creates a field which just contains month/year
- Create a calculated field –> “{ FIXED [Order Date (Month / Year)]: SUM([Sales])}”
- Represents a Level Of Detail Expression (LOD) which fixes sales to this time dimension
- Create a dual axis chart which is containing sales and your calculated LOD
- Put this sheet as well as another sheet which works as a filter on a dashboard to see the individual performance compared to the overall performance
Leave a Reply