Blog

20
SEP
2018

Internet of Things

Kommentare : 0


As the term Internet of Things (IoT) is climbing up on many “hype cycle hills” more and more companies are starting to leverage the data each and every device is creating. By being involved in helping start-ups, medium-sized and enterprise companies to making sense out of their IoT data you can definitely see that a lot of requirements in this area are very similar! Even if the device types, data volumes, back-end systems as well as the distribution of the knowledge gathered within the analysis can vary a lot – certain aspects are being asked all the time!

http://tableaufans.com/wp-content/uploads/2018/09/Tableaufans.com-Internet-of-Things-IoT-Examples-Distribution-Outlier-Clustering-Workbook-Dashboard-Preview-v5.mp4

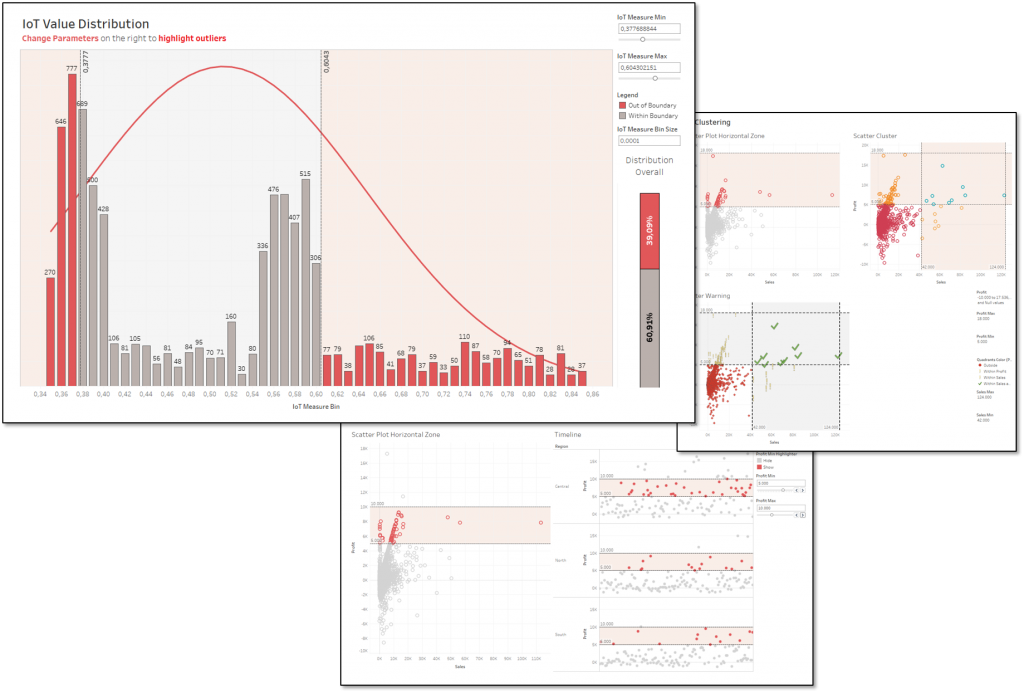
This very short blog post initiates a new category called IoT. It deals with some of the most frequently asked questions in this area. Today I want to share a workbook as an output of a meeting with an enterprise client this morning where we’ve answered the following questions in a visual way right during the their asks:

  • How to plot normal distributions?
  • How to deal with zooming, highlighting and filtering?
  • How can custom parameters help in this context?
  • How to figure out the amount of data being analyzed within and outside of a defined range?
  • Hot to create reference lines and bands?
  • How to setup reference bands on histograms (bins)?
    (Simply convert your “Bin” from Discrete (Blue) to Continuous (Green) )


As you can’t answer every question with one sentence I’m going to share the workbook created below. I hope by playing around with the parameters on the dashboard you get inspired to integrate them in your dashboards, too! 😉

Do you want to get the workbook? Simply click on the picture below! 🙂


Timo Tautenhahn
Über den Autor
Timo originally coded his own BI-application by making use of different JAVA libraries. He Worked for IBM as BI-specialist and BA-architect before he joined Tableau. Favorite subject: JavaScript API

Teilen

  • google-share

Kommentare Cancel reply

*

*

captcha *

Categories

  • Admin Area (1)
  • Data Stories (1)
  • Developer (2)
  • Embedding API (2)
  • Extension API (11)
  • Geek Stuff (3)
  • Hacks (1)
  • Ideas (8)
  • Industry Related (1)
  • Neuigkeiten (6)
  • News (3)
  • Performance (2)
  • Salesforce (1)
  • SAP (1)
  • Success Stories (1)
  • Tableau 10 (1)
  • Tableau 9 (1)
  • Tableau Server (3)
  • Tableau Visualization Extensions (1)
  • Tipps & Tricks (10)
  • Tips & Tricks (1)
  • Tutorials (14)
  • Visual Inspiration (8)

Tags

artilize Azure bericht Cloud Cloud Database conference Datalake dynamisch embed Embedding Extension API Extract API html javascript api kpi mobile munich news on-demand on-tour parameter RLS Salesforce SAP SAP BW Security Snowflake SSO tc Write Back

Last posts

Timo Tautenhahn - Tableaufans.com - Tableau Visualization Extensions - Create and share your own chart types - Live Devs on Stage TC21

Tableau Visualization Extensions

Thursday, 11. November 2021

How to configure Tableau Online Single Sign-On with Salesforce as Identity Provider?

Monday, 16. November 2020

Tableau Extensibility Framework

Thursday, 17. September 2020

Embedding Tableau Responsively

Tuesday, 26. May 2020

Show Empty Rows and Columns

Tuesday, 24. December 2019
  • Blog
  • About
  • Contact
  • Legal
© 2019 - tableaufans.com - All rights reserved
Concept and design: www.emodia.de