Blog

From raw data to final dashboards
09
MAR
2016

How to transform street data into geocodes

Kommentare : 0

Today I want to share with you some ideas around transforming raw data into something more visual and valuable. The video below is demonstrating:

  1. Copying data containing street names from a PDF
  2. Pasting this into a free online tool (Batch Geocode) to get LAT and LONG
  3. Saving the result as a CSV
  4. Connecting Tableau with this CSV
    1. Setting the delimiter right
    2. Setting the text qualifier right
    3. Explain how to solve “.” and “,” issues when working with flat files
    4. How to leverage data source filters
  5. Plotting results on a map
  6. Extract information via SPLIT and RIGHT calculations
  7. Visual grouping
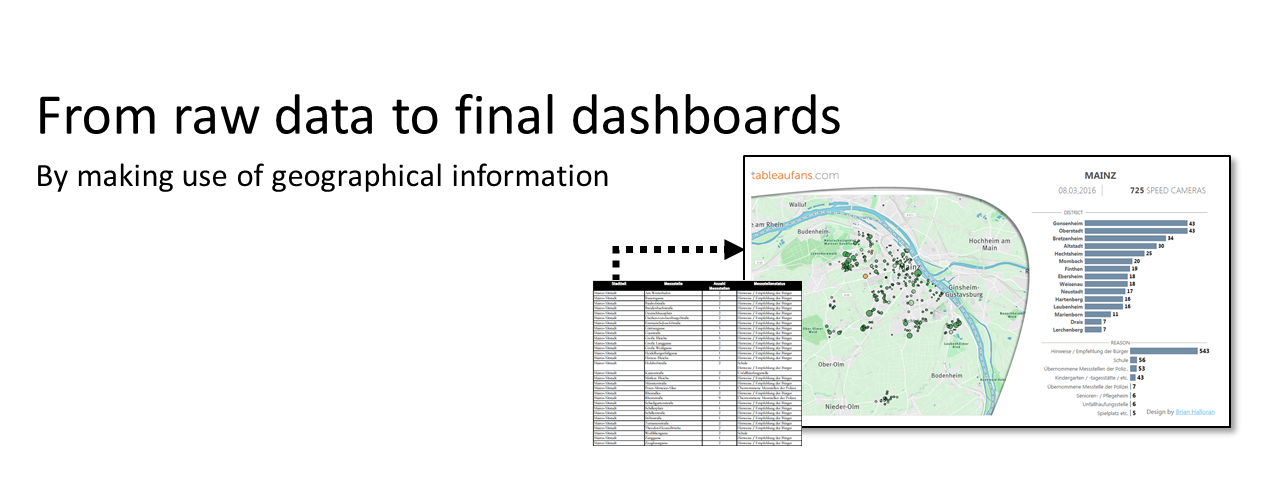
  8. Final interactive dashboard


Links from within the video:

  • Final Dashboard: On Tableau Public
  • Data: Speed Cameras Mainz
  • Geocoding Tool: Batch Geocode
  • Visual Idea: Brian Halloran
Timo Tautenhahn
Über den Autor
Timo originally coded his own BI-application by making use of different JAVA libraries. He Worked for IBM as BI-specialist and BA-architect before he joined Tableau. Favorite subject: JavaScript API

Teilen

  • google-share

Kommentare Cancel reply

*

*

captcha *

Categories

  • Admin Area (1)
  • Data Stories (1)
  • Developer (2)
  • Embedding API (2)
  • Extension API (11)
  • Geek Stuff (3)
  • Hacks (1)
  • Ideas (8)
  • Industry Related (1)
  • Neuigkeiten (6)
  • News (3)
  • Performance (2)
  • Salesforce (1)
  • SAP (1)
  • Success Stories (1)
  • Tableau 10 (1)
  • Tableau 9 (1)
  • Tableau Server (3)
  • Tableau Visualization Extensions (1)
  • Tipps & Tricks (10)
  • Tips & Tricks (1)
  • Tutorials (14)
  • Visual Inspiration (8)

Tags

artilize Azure bericht Cloud Cloud Database conference Datalake dynamisch embed Embedding Extension API Extract API html javascript api kpi mobile munich news on-demand on-tour parameter RLS Salesforce SAP SAP BW Security Snowflake SSO tc Write Back

Last posts

Timo Tautenhahn - Tableaufans.com - Tableau Visualization Extensions - Create and share your own chart types - Live Devs on Stage TC21

Tableau Visualization Extensions

Thursday, 11. November 2021

How to configure Tableau Online Single Sign-On with Salesforce as Identity Provider?

Monday, 16. November 2020

Tableau Extensibility Framework

Thursday, 17. September 2020

Embedding Tableau Responsively

Tuesday, 26. May 2020

Show Empty Rows and Columns

Tuesday, 24. December 2019
  • Blog
  • About
  • Contact
  • Legal
© 2019 - tableaufans.com - All rights reserved
Concept and design: www.emodia.de