Blog

08
NOV
2017

Advanced Analytics

Kommentare : 9

Yesterday I’ve had a great meeting with Alican Polat. Alican has got roughly 20 years of experience in the analytics industry!!! The spectrum he covers in this area reaches from architectural design, over SAP, Tableau and other BI front end as well as backend tools, too machine learning algorithms!

Today I’d love to quickly share an architectural design he came up with throughout this year. As a machine-learning enthusiast, he likes to code R and Python code at the same time. “Depending on the use case there are libraries out there which sometimes are faster in R and other times in Python” he says.

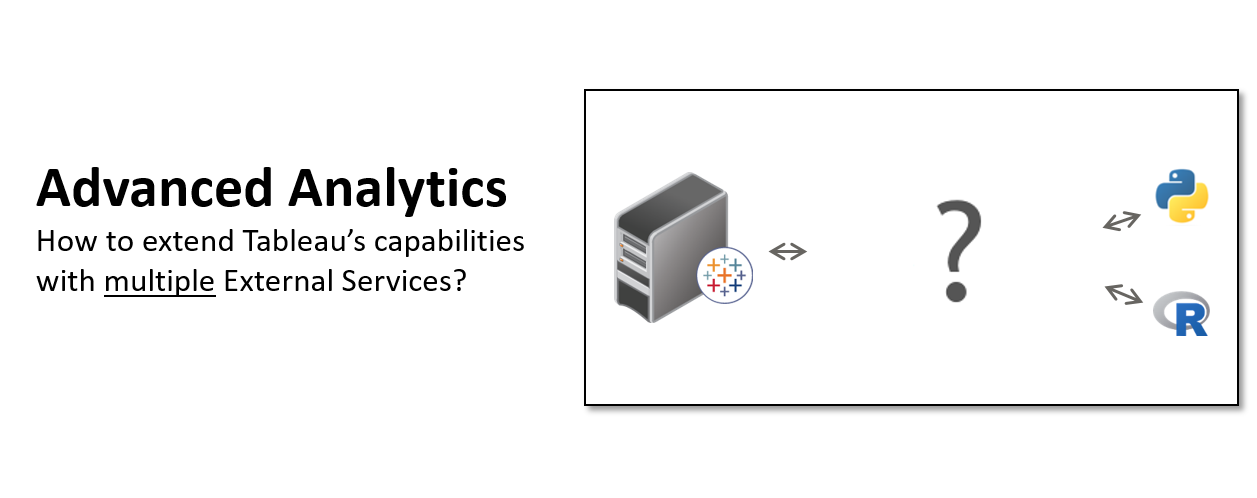
Based on Tableau’s documentation one could think that you can just use a single External Service like Python and R. The truth is, you can leverage both at the same time if you’re leveraging Alican’s architecture:

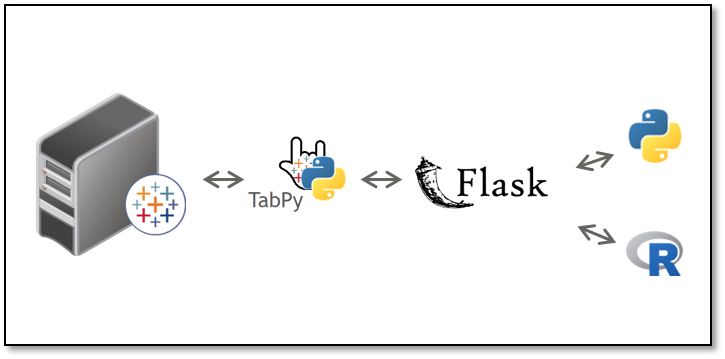
He set up TabPy to communicate with Tableau Server. TabPy is routing every R and Python function to Flask, which simply acts as a proxy. Based on a rules (e.g. naming conventions) Flask decides where to route the request to either R or Python before the result set does get send back to Tableau Server. 

Side note:

  • Matlab is not used in their current environment and would be interesting to see if Flask could route requests to Matlab, too
  • Julia (=”high-level, high-performance dynamic programming language for numerical computing”) could might be added to this architecture like Alexander Loth describes in his blog post


If you like this approach please leave a comment below and Alican Polat or myself will make a follow up post with more details about it.

Timo Tautenhahn
Über den Autor
Timo originally coded his own BI-application by making use of different JAVA libraries. He Worked for IBM as BI-specialist and BA-architect before he joined Tableau. Favorite subject: JavaScript API

Teilen

  • google-share

9 Kommentare

  1. Avatar
    Bryan 30. November 2017 at 20:06 Reply

    Please do a follow-up!!! We are looking at incorporating TabPy in more of our reporting. Given we have people who are strong in both Python and R this looks like it would be great and I would love to see how you set-it up in more detail! (I’ve looked into Rserve and the inability to specify end-points compromises it’s power tremendously compared to TabPy as you can’t perform any of the necessary transformations within the script).

  2. Avatar
    Timothy Vermeiren 1. December 2017 at 13:38 Reply

    This certainly is interesting! What configuration or setup of Flask is necessary to get this setup? I got TabPy to work without issues, but other than that I’m rather unfamiliar with Python and the likes.

  3. Avatar
    Blair Hutchinson 10. April 2018 at 22:48 Reply

    Really interested in learning more about this! Like Timothy, I’m curious how Flask plays a role in this system.

    Is this suggesting that you would need 2 TabPy instances?

  4. Avatar
    Kool khanna 15. August 2018 at 19:00 Reply

    Hi Timo and alican, thanks for the article of hope. Are you able to share the link of detailed article like what does it to take to have it implemented practically.

    Very interested to know the details please.

    Many thanks in advance.

  5. Avatar
    Ashish 9. January 2019 at 12:16 Reply

    This will be really useful as R and python both are tremendously popular languages, we have users who want to use either of them and build their visualizations.

    Although I would really want Tableau to provide some features on these lines as it would be easier to implement and maintain.

    Please share more details on how to implement it.

    Thanks a lot!!

  6. Avatar
    Constantin 10. January 2019 at 10:58 Reply

    Really, really interesting! Can you share more details on how you have set it up?

  7. Timo Tautenhahn
    Timo Tautenhahn 15. January 2019 at 16:30 Reply

    Hi Tableaufans,
    The customer changed the initial configuration a little bit. I‘ll make another post about it in this quarter which will contain pseudo code and an updated diagram.

    Cheers,
    Timo

  8. Timo Tautenhahn
    Timo Tautenhahn 23. April 2019 at 17:11 Reply

    Hi Tableaufans,
    I hope you’ve already seen the second part of this blog post:

    https://tableaufans.com/ideas/advanced-analytics-multiple-external-services-part-2/

  9. Pingback: Why Decide? Using Both R and Python in Tableau – at the Same Time! – Konstantin Greger

Kommentare Cancel reply

*

*

captcha *

Categories

  • Admin Area (1)
  • Data Stories (1)
  • Developer (2)
  • Embedding API (2)
  • Extension API (11)
  • Geek Stuff (3)
  • Hacks (1)
  • Ideas (8)
  • Industry Related (1)
  • Neuigkeiten (6)
  • News (3)
  • Performance (2)
  • Salesforce (1)
  • SAP (1)
  • Success Stories (1)
  • Tableau 10 (1)
  • Tableau 9 (1)
  • Tableau Server (3)
  • Tableau Visualization Extensions (1)
  • Tipps & Tricks (10)
  • Tips & Tricks (1)
  • Tutorials (14)
  • Visual Inspiration (8)

Tags

artilize Azure bericht Cloud Cloud Database conference Datalake dynamisch embed Embedding Extension API Extract API html javascript api kpi mobile munich news on-demand on-tour parameter RLS Salesforce SAP SAP BW Security Snowflake SSO tc Write Back

Last posts

Timo Tautenhahn - Tableaufans.com - Tableau Visualization Extensions - Create and share your own chart types - Live Devs on Stage TC21

Tableau Visualization Extensions

Thursday, 11. November 2021

How to configure Tableau Online Single Sign-On with Salesforce as Identity Provider?

Monday, 16. November 2020

Tableau Extensibility Framework

Thursday, 17. September 2020

Embedding Tableau Responsively

Tuesday, 26. May 2020

Show Empty Rows and Columns

Tuesday, 24. December 2019
  • Blog
  • About
  • Contact
  • Legal
© 2019 - tableaufans.com - All rights reserved
Concept and design: www.emodia.de