Category: Visual Inspiration

  • Interactive Company Reports

    Interactive Company Reports


    In 2014 I’ve been blogging about “Interactive Company Reports” for the first time. The initial post is just available in German, but the links and ideas will quickly be reiterated in this post. 
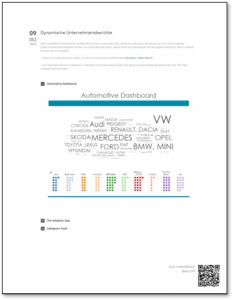
    Moritz Pawelke (after working at Deloitte as Director | Digital & Analytics @ Financial Advisory he is now working as Head of Consulting at M2 – a Tableau Partner) had this idea of making company reports more interesting by providing people an interactive version of it online. This massively extends the reach of a publication and you can way better review what people find interesting! In order to provide people the ability to jump from a first static impression to an interactive one (being able to filter to the user’s needs) you can easily provide people with QR-codes directly within your report. My visual example of it back in the days was the picture on the right which got adopted quite soon.

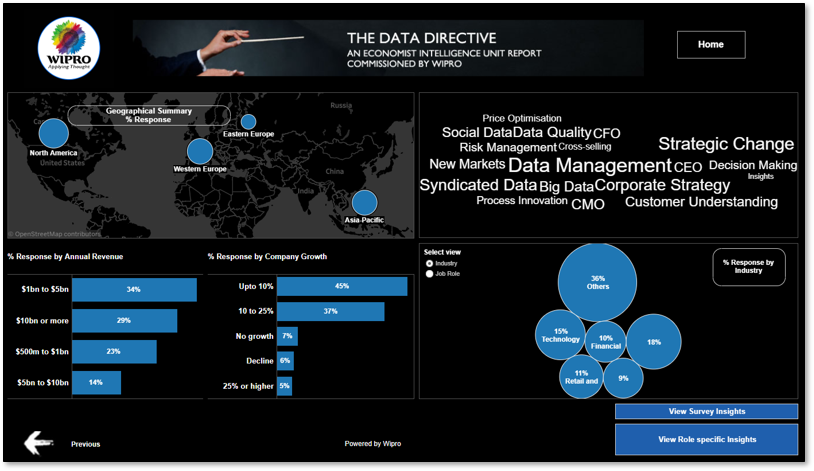
    An IT-Service company based out of India called Wipro created an appealing interactive report as part of a survey in 2013:
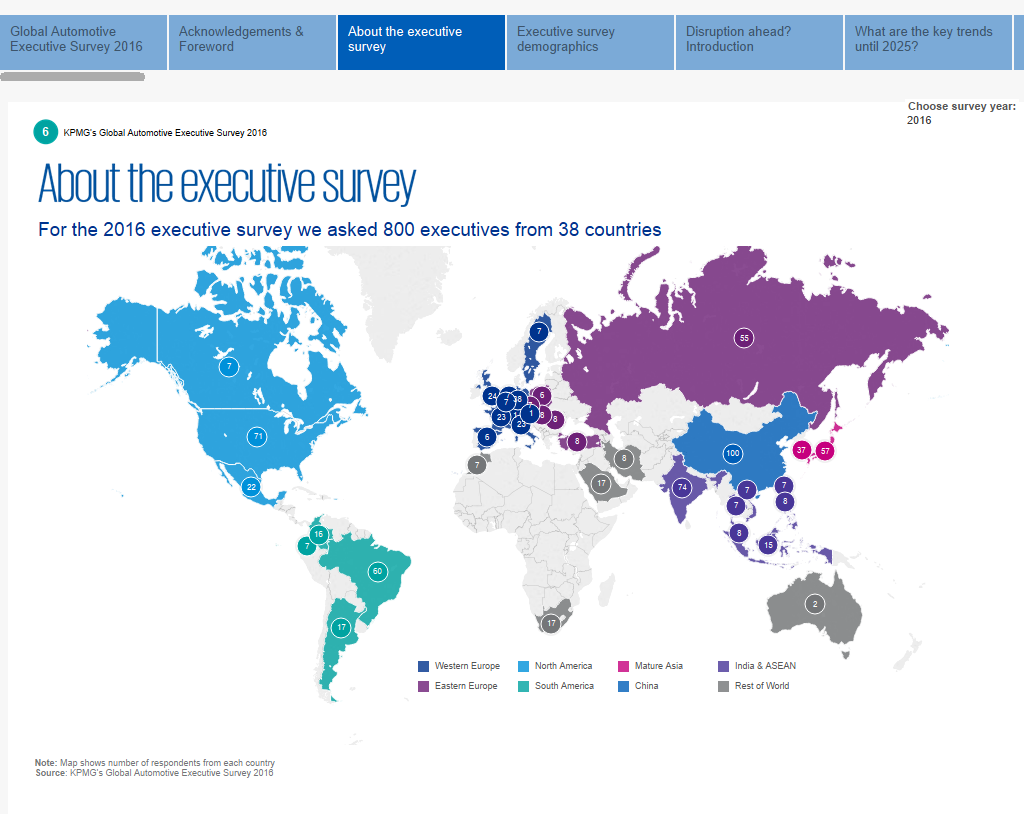
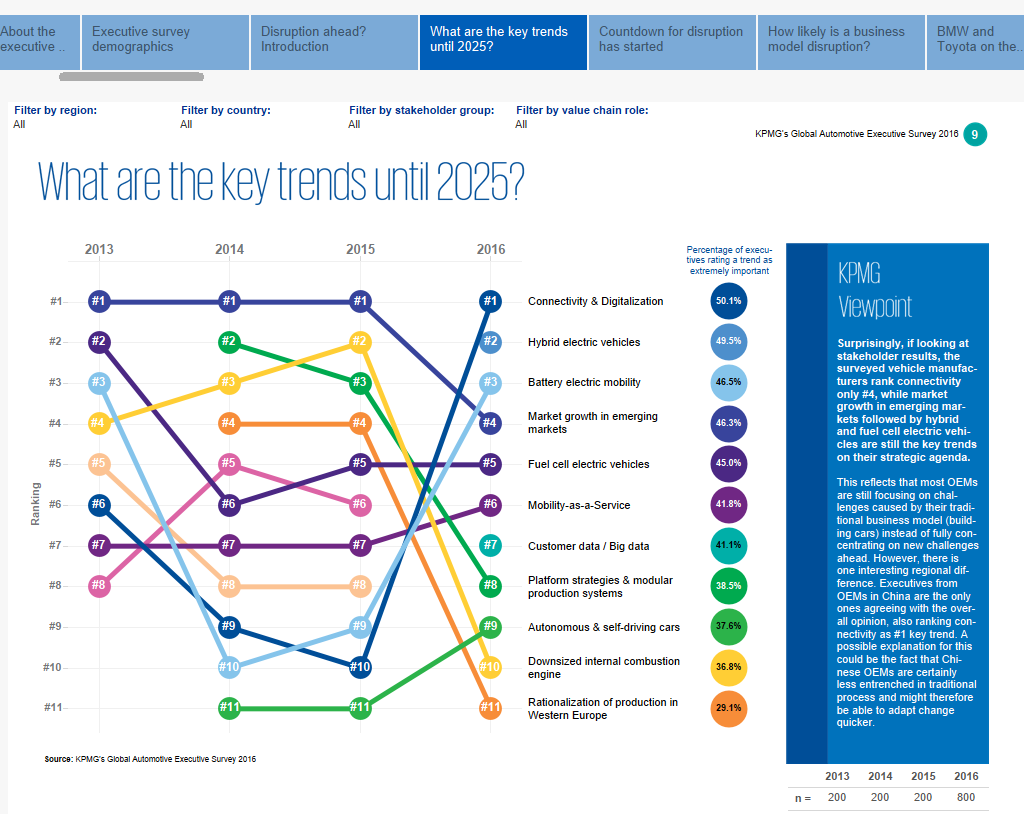
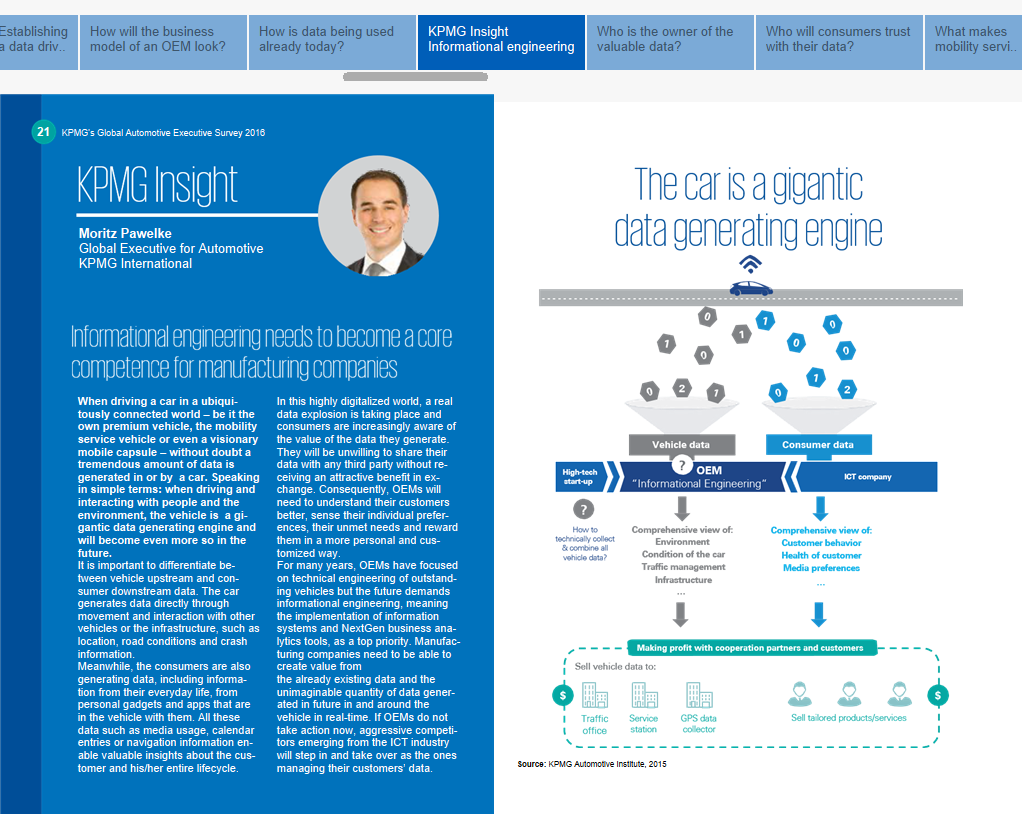
    A little bit later Moritz Pawelke and myself got introduced to each other. We put our heads together for KPMG’s first interactive version of their biggest annual survey which just got published as PDF and printed versions back then. The work resulted in an interactive version of KPMG’s Global Automotive Executive Survey. This has been a great success and it leveraged Tableau Data Stories just great! If you’re searching for impressions for nice color codings I can highly recommend you to look at 2016th Tableau Data Story:


    This year Dieter Becker Global & EMA Head Automotive Practice and Aline Dodd Global Executive for Automotive slightly changed the approach on how they’ve published the report. So rather than staying with an interactive Data Story they’ve leveraged similar web techniques I’ve been using for my initial demo post. Now you can navigate between different dashboards on their web app depending on your interests. Nice animations makes this visually very appealing. In order to get this year’s report out there we thank Florian Ramseger, Katie Mertens, Olga Kolcheva and Konstantin Greger for their great work!

    So feel free to get inspired by the interactively version here.


  • Internet of Things

    Internet of Things


    As the term Internet of Things (IoT) is climbing up on many “hype cycle hills” more and more companies are starting to leverage the data each and every device is creating. By being involved in helping start-ups, medium-sized and enterprise companies to making sense out of their IoT data you can definitely see that a lot of requirements in this area are very similar! Even if the device types, data volumes, back-end systems as well as the distribution of the knowledge gathered within the analysis can vary a lot – certain aspects are being asked all the time!

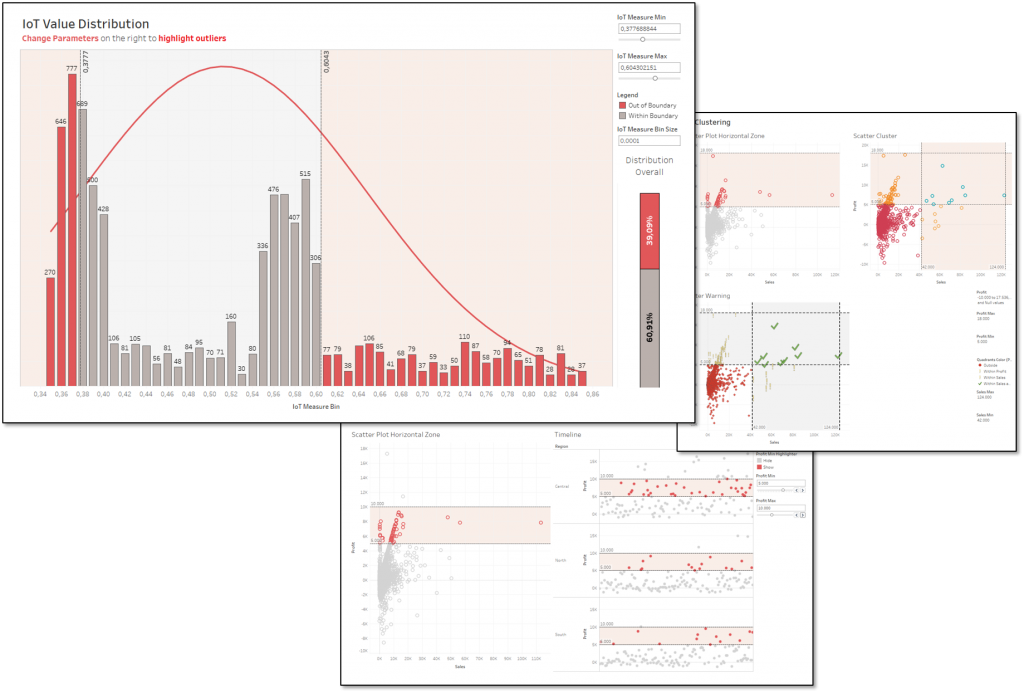
    This very short blog post initiates a new category called IoT. It deals with some of the most frequently asked questions in this area. Today I want to share a workbook as an output of a meeting with an enterprise client this morning where we’ve answered the following questions in a visual way right during the their asks:

    • How to plot normal distributions?
    • How to deal with zooming, highlighting and filtering?
    • How can custom parameters help in this context?
    • How to figure out the amount of data being analyzed within and outside of a defined range?
    • Hot to create reference lines and bands?
    • How to setup reference bands on histograms (bins)?
      (Simply convert your “Bin” from Discrete (Blue) to Continuous (Green) )


    As you can’t answer every question with one sentence I’m going to share the workbook created below. I hope by playing around with the parameters on the dashboard you get inspired to integrate them in your dashboards, too! 😉

    Do you want to get the workbook? Simply click on the picture below! 🙂


  • Customer Portals

    Customer Portals

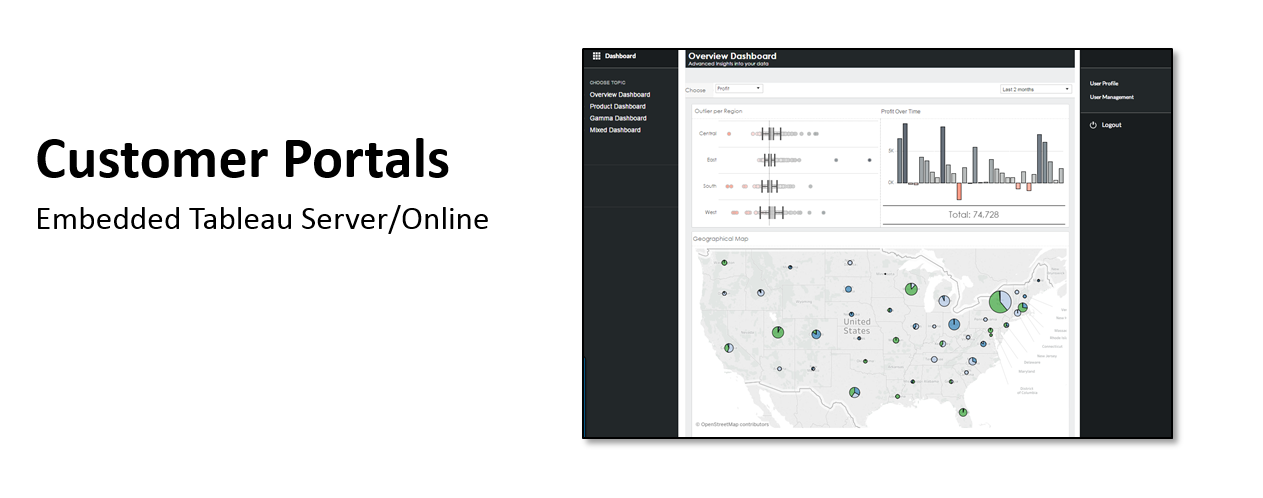
    Embedding Tableau Server or Tableau Online into customer portals is quite a very popular use case and more and more companies are providing Analytics to their clients. There are many ways of doing that and Tableau‘s Community is providing hundreds of great articles and videos around it.

    As I was on customer side in Switzerland this morning to actually talk about it I decided to create this tiny little blog post. It’s basically meant to demonstrate one very basic example of how such an integration can actually look like for an enduser.

    Basic Example for a Customer Portal with Tableau

  • Custom Tableau Demo in 15 Minutes

    Custom Tableau Demo in 15 Minutes

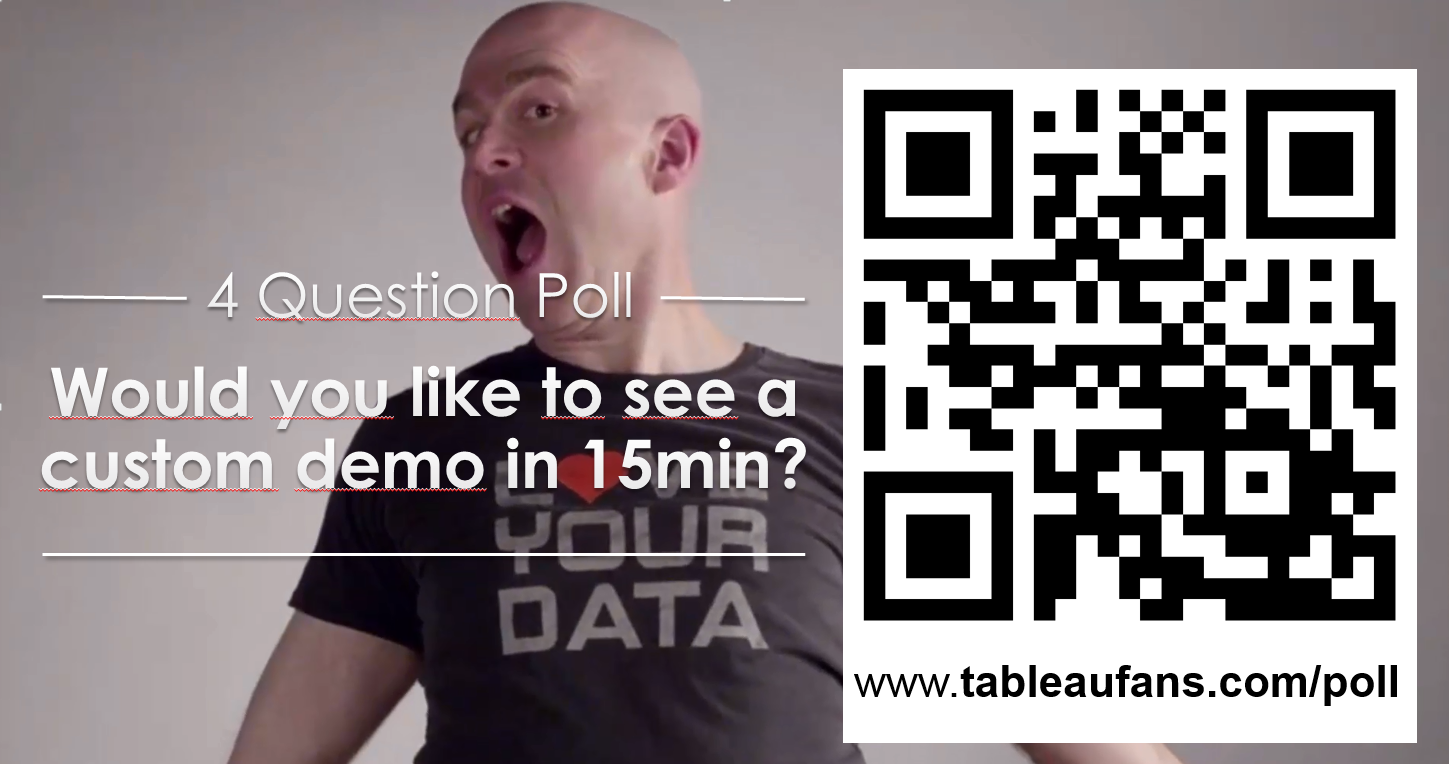
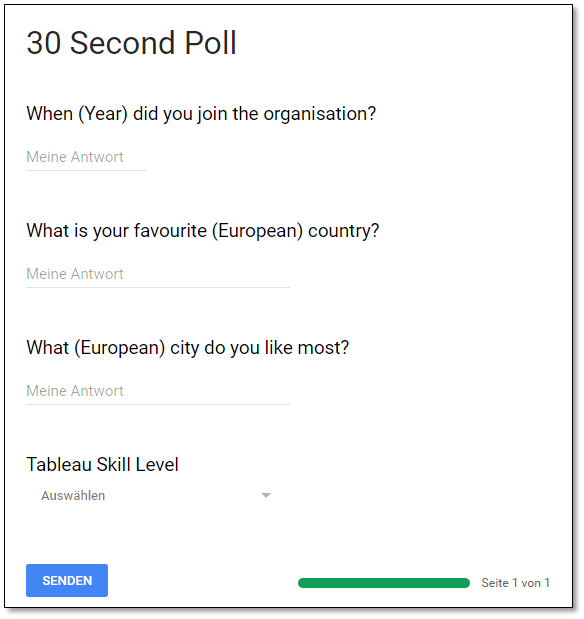
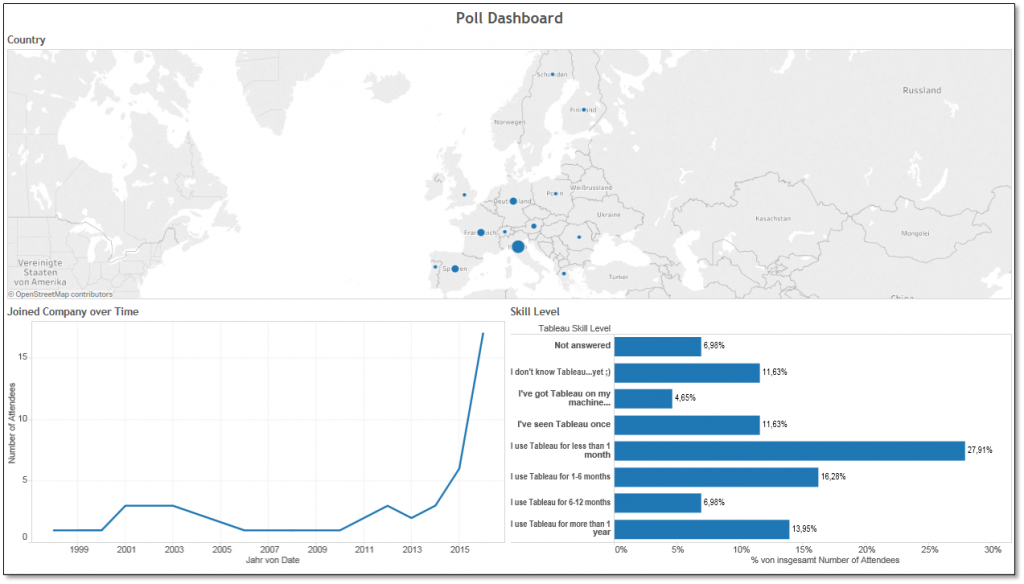
    Today I want to reference a post I made in March 2015. Back in the days I was recording a video about different ways to start a Tableau presentation. A couple of days ago I got invited to give a TechTalk speach at a bank in Frankfurt, Germany. In order to introduce the crowd to Tableau I wanted to do a custom demo. Therefore I was creating a simple Google Form which stores results in a Google Spreadsheet which Tableau can connect natively to since version 10.

    Questions
    The coolest way to demonstrate the power of Tableau should contain a time information (an exact date would be best!), something geographical and some interesting categories. In order to keep it as simple and fast as possible for the audience to answer my questions I was keeping it as easy as possible:

    Answers
    Answers get stored in a Google Spreadsheet. I was adding a couple of things to the default sheet like:      

    • Date: I was not allowed to ask the exact date when people did join the company. In order to demonstrate Tableau’s powerful TIME capabilities I was randomly adding days and months to the actual year when people joined the company
    • Dummy Data: If for whatever reasons people wouldn’t have been able to answer the questions – this would have been my backup data I produced upfront
    • Company: This column alows me to compare companies (anonymously) during future demos


    Outcome
    The best part starts once you take the data and turn it into something meaningful. You can either connect Tableau live to your Google Spreadsheet or simply copy and paste the data into Tableau (which oftentimes creates an even bigger WOW-EFFECT). Whatever you’re coming up with keep in mind that every single drag and drop is already demonstrating the power of Tableau! And while you’re asking questions while you’re already answering them you’ll learn a lot about your audience if you add something like “Tableau Skill Level / How long are you already using Tableau” to one of your questions! This will tell you if you can jump into more sophisticated topics within Tableau or not after you’re “TechTalk / Tableau Day KICKOFF Demo” 😉


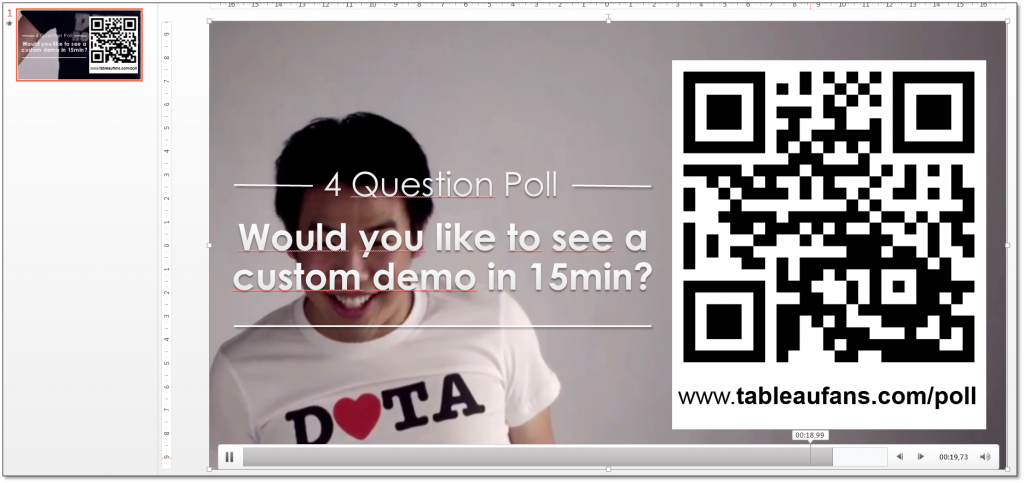
    Last but not least please feel free to download the PowerPoint template with AWESOME TABLEAU COLLEAGUES jumping in the background and customize it to your needs (tons of URL + QR code creators are out there! 😉


    Tableaufans.com – PowerPoint Template – Jumping Tableau Colleagues


  • SwipeRight

    SwipeRight

    Our Tableau Conference in Austin just started and more than 12.000 customers made their way to Texas!

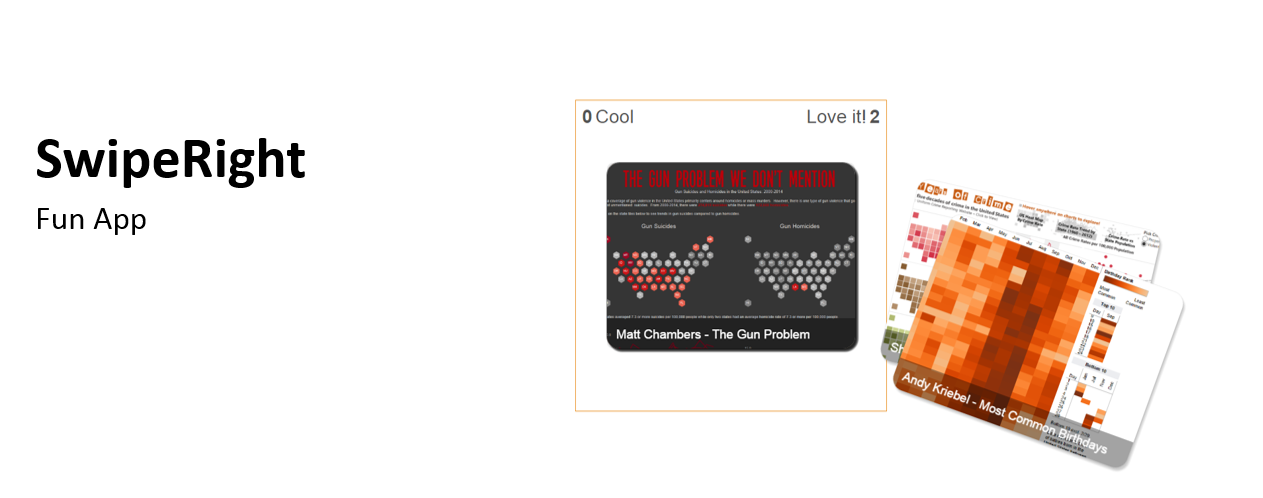
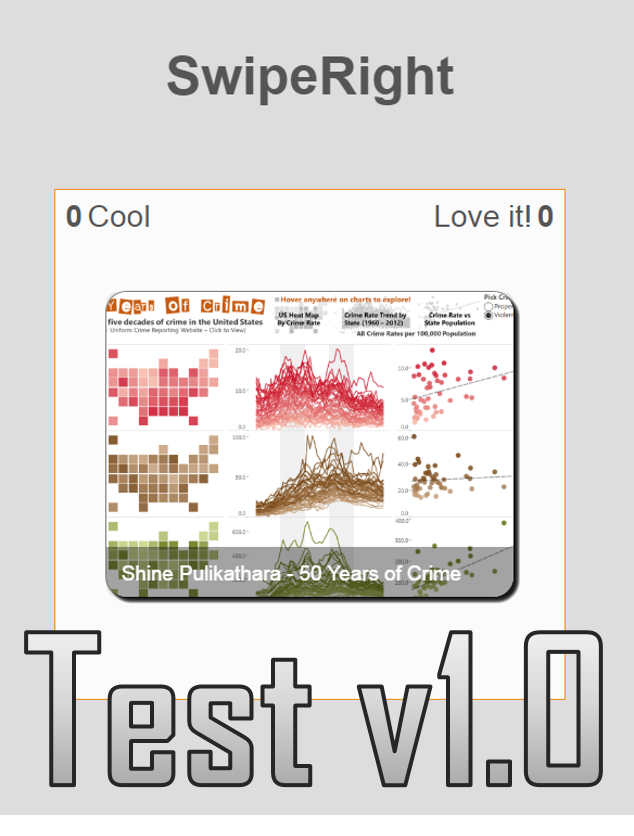
    Today I wanna post about a fun app which can be used in many different ways! It’s called “SwipeRight” and I’m more than happy to talk about it during as well as after my sessions “Hot. Dirty. Sets.” and “Customization and Embedding with the Javascript API” here in Austin.

    Please feel free to reach out to me via the “Data 16” App or simply by leaving a comment on this blog post. Enjoy the conference and I’m looking to talk to as many Tableaufans like you as possible!!!

    swiperight-test-v1-0

    P.S. Simply click on the picture to get to the small web app called SwipeRight.

  • Tableau Report Template

    Tableau Report Template

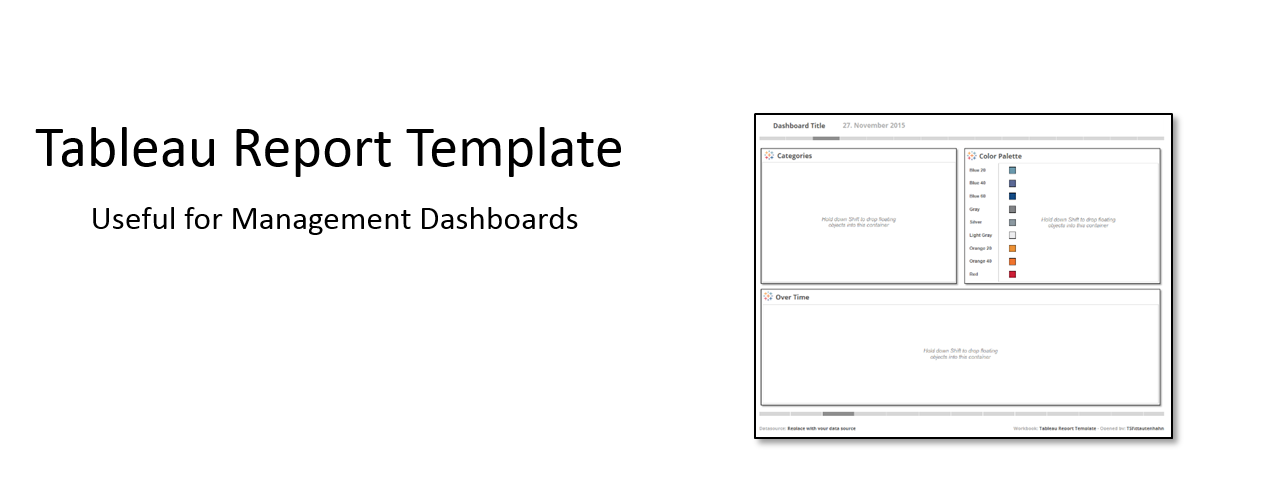
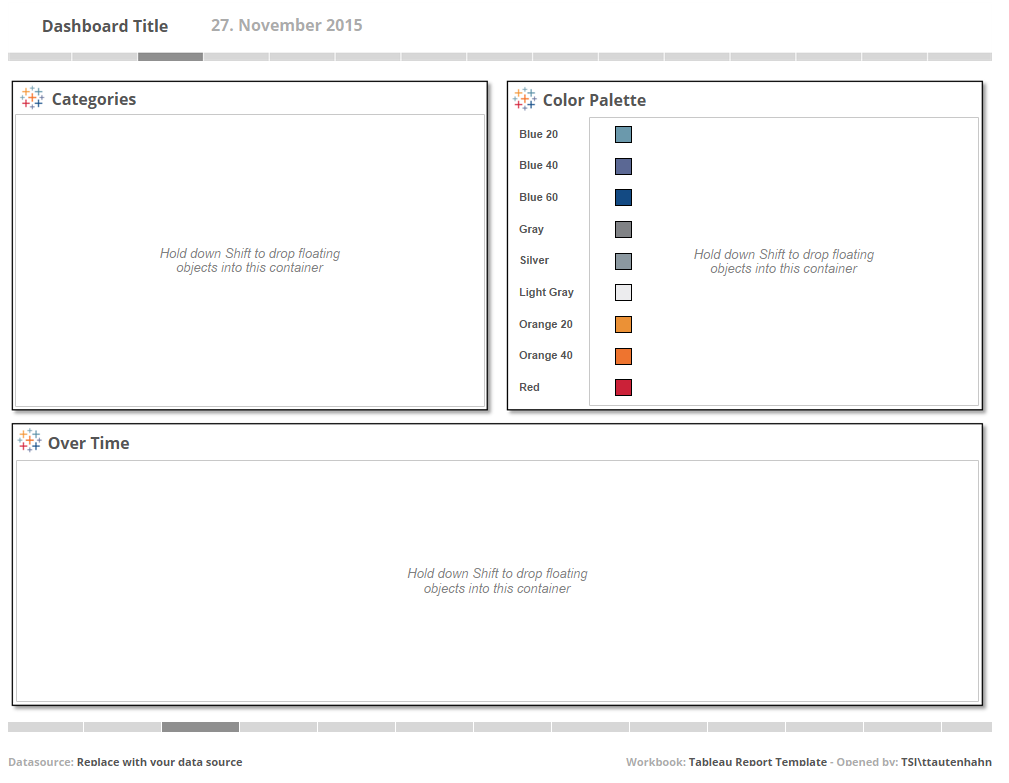
    There are many great templates and design examples out there. Due to the fact that different people like different things and companies do have their own corporate style guides use this one as a template to customize it. Feel free to download it on Tableau public and modify it so that it fits to your corporate design and the needs you’re having.

    Tableau Report Template

    Another great template for mobile optimized dashboards can be found from one of our Tableau Zen Masters: Kelly Martin

    http://www.tableau.com/about/blog/2015/8/tips-building-dashboards-smartphone-43225


  • Tableau HR Demo

    Tableau HR Demo

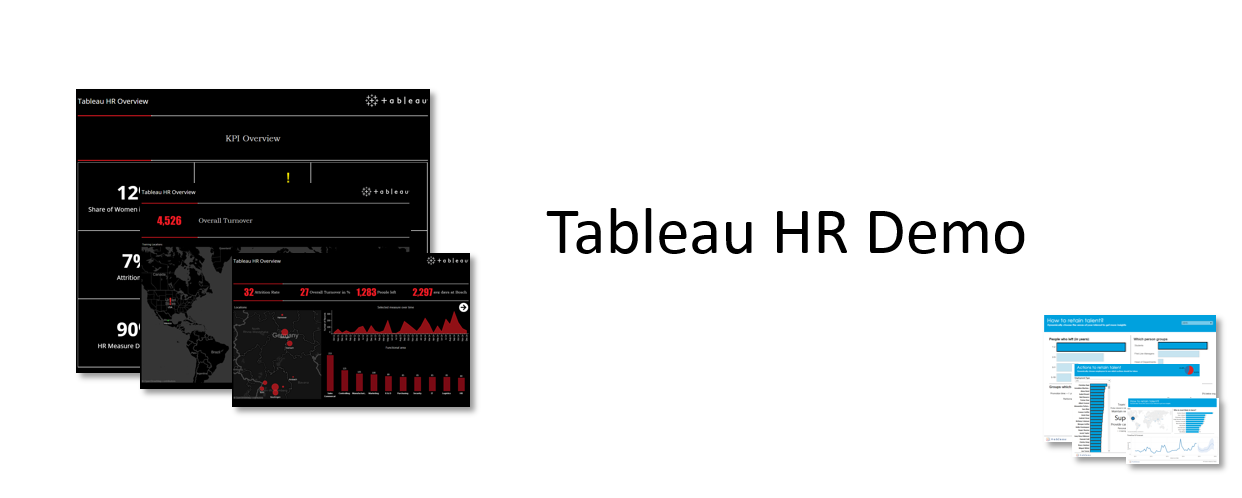
    If you ask yourself how Tableau could look like in an HR environment – here is the answer:

    This video is demonstrating how a global HR director could analyze his most important KPIs. From a high level overview you’ll see how you can navigate yourself all the way down from a country, location, department, functional area perspective to single employee or employee group level perspective. The last and most important step demonstrates that this is just one way of how you could follow along such a path. The beauty of Tableau is that you can easily add, modify or analyze content which is not already created for you as an end user.

    Enjoy watching and we’re looking forward to get feedback from you!

    P.S. Design is always important and therefore I want to reference and share my sources of awesome design examples:
    Shweta Savale – Partner & Head of Client Engagement at Syvylyze Analytics LLP / Tableau trainer & consultant and their great gallery

    Moritz Pawelke – Global, EMA & German Executive for Automotive at KPMG our previous post about our engagement together with KPMG

    Decisive Data – Consulting Company and Tableau Partner based out of Redmond, WA who are also having a great Tableau public gallery

  • Visual Inspiration

    Deutsch

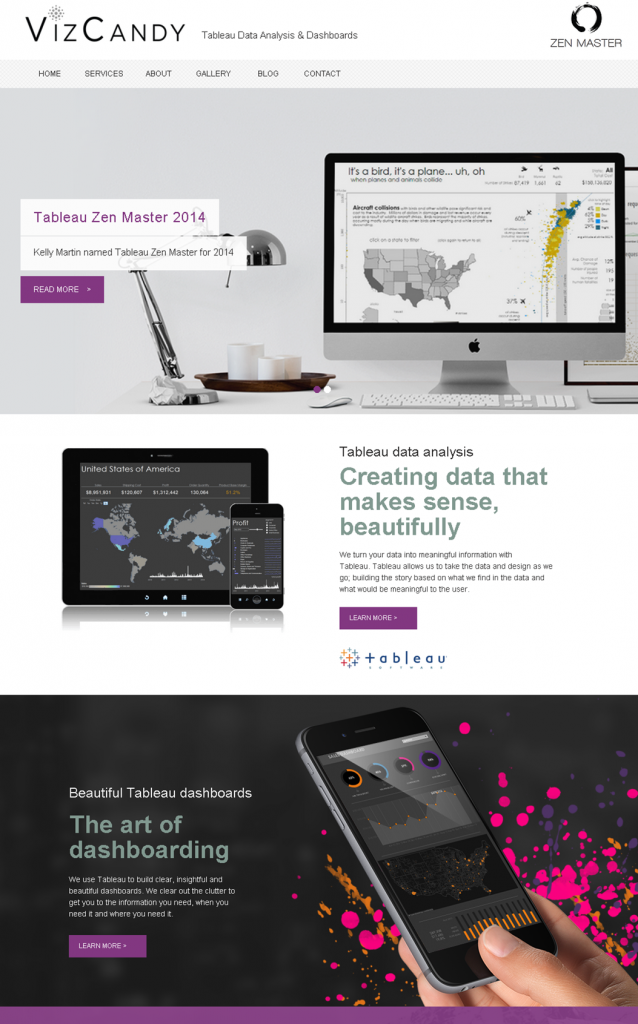
    Heute öffnen wir eine neue Kategorie mit dem Namen “Visual Inspiration” bei Tableaufans.com. Hier werden wir künftig Links und Beispiele zu optisch ansprechend gestalteten Dashboards mit euch teilen.

    Im ersten Teil darf ich euch Kelly Martin vorstellen. Sie wurde 2014 zu einem Tableau Zen Master gekührt und hat auf Ihrer Website eine ganze Reihe an Beispielen veröffentlicht. Könnt ihr das auch oder fragt ihr euch wie das möglich ist? Feedback, Wünsche und Kommentare sind wie immer herzlich willkommen!

    VizCandy


    English

    Today we want to share some visual inspiration with you. Feel free to visit Kelly’s website to get some ideas around how you can design your dashboards in the future. Are you able to do this by your own?

    Please feel free to share your thoughts about it with us!

    VizCandy