Blog

Tableau HR Demo
22
SEP
2015

Tableau HR Demo

Kommentare : 4

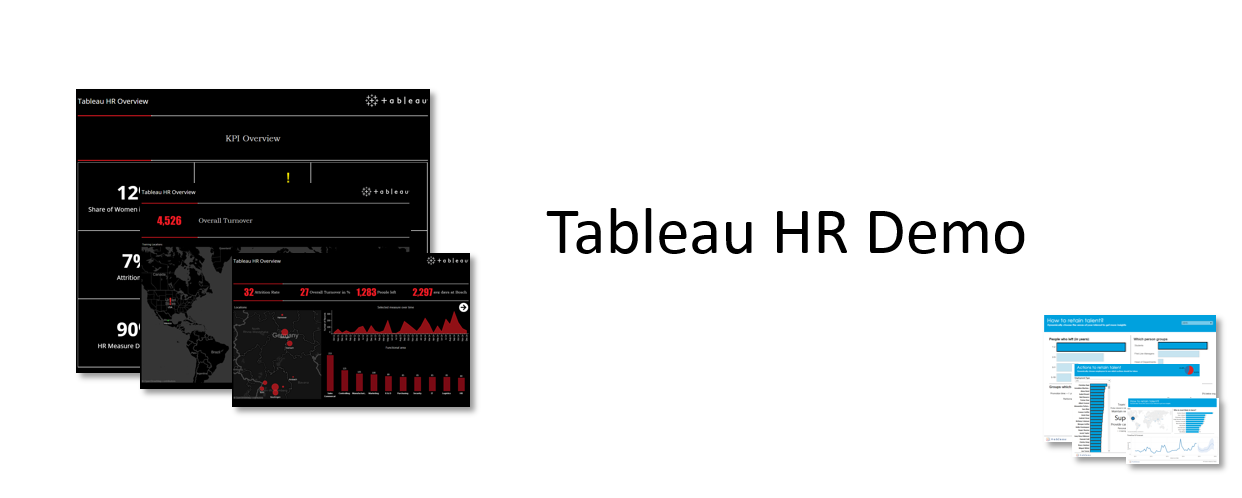
If you ask yourself how Tableau could look like in an HR environment – here is the answer:

This video is demonstrating how a global HR director could analyze his most important KPIs. From a high level overview you’ll see how you can navigate yourself all the way down from a country, location, department, functional area perspective to single employee or employee group level perspective. The last and most important step demonstrates that this is just one way of how you could follow along such a path. The beauty of Tableau is that you can easily add, modify or analyze content which is not already created for you as an end user.

Enjoy watching and we’re looking forward to get feedback from you!

P.S. Design is always important and therefore I want to reference and share my sources of awesome design examples:
Shweta Savale – Partner & Head of Client Engagement at Syvylyze Analytics LLP / Tableau trainer & consultant and their great gallery

Moritz Pawelke – Global, EMA & German Executive for Automotive at KPMG our previous post about our engagement together with KPMG

Decisive Data – Consulting Company and Tableau Partner based out of Redmond, WA who are also having a great Tableau public gallery

Timo Tautenhahn
Über den Autor
Timo originally coded his own BI-application by making use of different JAVA libraries. He Worked for IBM as BI-specialist and BA-architect before he joined Tableau. Favorite subject: JavaScript API

Teilen

  • google-share

4 Kommentare

  1. Avatar
    Tuoc Le 29. October 2015 at 5:31 Reply

    Hello-

    Where can I download the demo code? I got a chance to see you present at TC2015. So sorry I don’t understand German.

    Thanks,
    Tuoc.

    • Timo Tautenhahn
      Timo Tautenhahn 20. November 2015 at 14:30 Reply

      Hi Tuoc,
      no worries, we’ll help you in English 😉

      So what do you mean by demo codes?

      Cheers,
      Timo

  2. Avatar
    steve 13. May 2016 at 11:34 Reply

    what a nice job! could you provide me the entire workbook so to study your kpi?
    thanks,
    steve

    • Timo Tautenhahn
      Timo Tautenhahn 13. May 2016 at 12:59 Reply

      Hey Steve,
      glad you like it! Actually the workbook you see me demonstrating within the video can contain customer information. Therefore I’m really sorry, but I can’t share it with you. 🙁

      Is there anything in particular you want to understand/reproduce where I can help you with? I’d be more than happy to help!

      Cheers,
      Timo

Kommentare Cancel reply

*

*

captcha *

Categories

  • Admin Area (1)
  • Data Stories (1)
  • Developer (2)
  • Embedding API (2)
  • Extension API (11)
  • Geek Stuff (3)
  • Hacks (1)
  • Ideas (8)
  • Industry Related (1)
  • Neuigkeiten (6)
  • News (3)
  • Performance (2)
  • Salesforce (1)
  • SAP (1)
  • Success Stories (1)
  • Tableau 10 (1)
  • Tableau 9 (1)
  • Tableau Server (3)
  • Tableau Visualization Extensions (1)
  • Tipps & Tricks (10)
  • Tips & Tricks (1)
  • Tutorials (14)
  • Visual Inspiration (8)

Tags

artilize Azure bericht Cloud Cloud Database conference Datalake dynamisch embed Embedding Extension API Extract API html javascript api kpi mobile munich news on-demand on-tour parameter RLS Salesforce SAP SAP BW Security Snowflake SSO tc Write Back

Last posts

Timo Tautenhahn - Tableaufans.com - Tableau Visualization Extensions - Create and share your own chart types - Live Devs on Stage TC21

Tableau Visualization Extensions

Thursday, 11. November 2021

How to configure Tableau Online Single Sign-On with Salesforce as Identity Provider?

Monday, 16. November 2020

Tableau Extensibility Framework

Thursday, 17. September 2020

Embedding Tableau Responsively

Tuesday, 26. May 2020

Show Empty Rows and Columns

Tuesday, 24. December 2019
  • Blog
  • About
  • Contact
  • Legal
© 2019 - tableaufans.com - All rights reserved
Concept and design: www.emodia.de