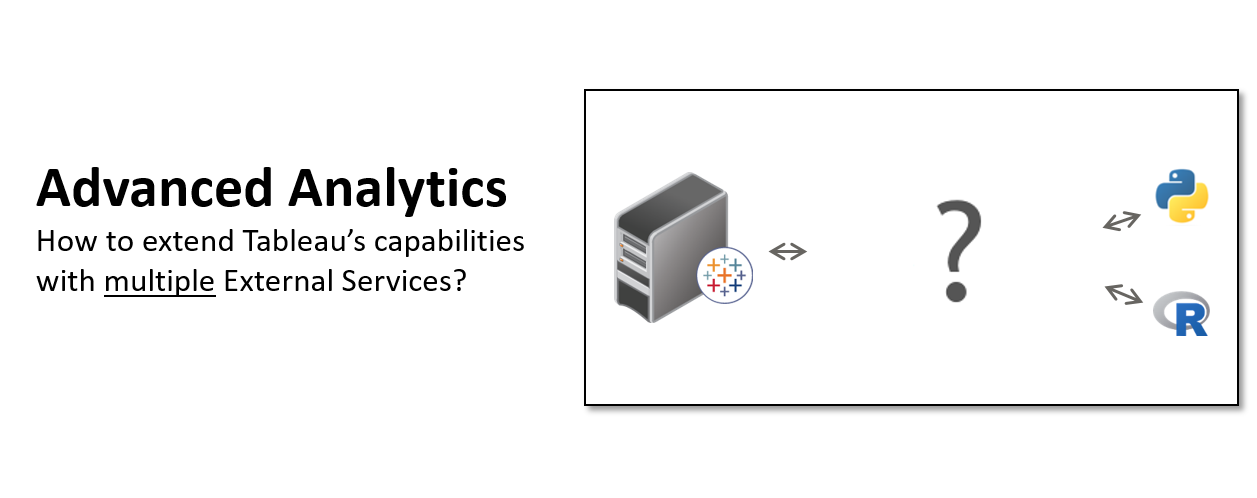
A very popular post for the many data scientists within the Tableau community has been this blog post around how to setup multiple External Services for Tableau. Therefore this post is meant to be the first follow up post on it. While the initial architectural diagram showed flask as an adapter between TabPy and R as well as Python, Alican Polat slightly adjusted this architecture. Now TabPy acts as a pure web service which routes the traffic to 2 other services in this case Flask or DeployR:

There are several ways on how you can decide which oh the 2 paths to follow along. One way could be a naming convention for your functions. So if your calculated field calls a function called R_GET_CUSTOMER_CHURN, TabPy could decide to forward this web service call down to deployR. On the other hand side the same request could be processed by Python if the receiving web service call within TabPy would process a prefix “P” for Python so that the request P_GET_CUSTOMER_CHURN gets routed to the top right according to the illustration above. You just need to deploy a function within TabPy in order to make this decision! This could be a prefix which you process within an if-then-else statement, a suffix, time of the day, Tableau parameter…
There is an infinite number of ways on how to decide whether to choose R or Python for the function call. So I just want to demonstrate one more way which would allow the end user to choose between on or the other. The 2nd and last code snipped in this post demonstrates an example which routes the traffic to either a Python or R based on a Tableau string parameter called “service”. It’s values could be predefined to R or PYTHON and set by the front end user of the dashboard. Of course it’s up to the administrator if individuals should have the power of choosing between one or another or if simply the creator of the dashboard should decide it based on the best library per use case.
So let’s say you’ve already setup TabPy according to GitHub or this German tutorial from Alexander Loth you go ahead and create a calculated field within Tableau. An easy first example to test if you’re getting back a result from TabPy would be:
SCRIPT_REAL('
    import numpy as np
    return np.corrcoef(_arg1,_arg2)[0,1]
',
SUM([Sales]), SUM([Profit]) )
Once this works you can move on by setting up:
- “Lifetimes“, a Python library (which you embed into Flask) to calculate Customer Lifetime Values and
- “BTYD“, an R implementation of it (on DeployR)
Within both – R and Python – you can then setup customer churn models. Alican in particular calculates within his models:
- How likely is it that a customer will continue to buy?
- How likely is it that a customer is going to buy a certain product?
On TabPy you need to define a function like the following one where a Tableau string parameter defines if R or Python is going to process the function you’re calling within a calculated field. In this example Python would be installed on the very same machine (localhost:8888) whereas the R service would be forwarded to a different host called myRserver with port 9090.
def get_customer_product_churn(customer, product, days, service):
    import requests
    if service = ‘PYTHON’
    r = requests.post('http://localhost:8888/lifetime_service', data = {
                                                                        'customer': customer,
                                                                        'product': product,
                                                                        'days': days,})
    if service = ‘R’
    r = requests.post('http://myRserver:9090/lifetime_service_withR', data = {
                                                                        'customer': customer,
                                                                        'product': product,
                                                                        'days': days,})


    serviceResult = r.json()
    return serviceResult['result']
I hope this post answers some of the burning questions you – the community – had. Please provide us with any kind of feedback below. I promise it hasn’t been the last blog post around advanced analytics, Python and R! 😉


Leave a Reply