Category: Tutorials

  • Row-Level Security with Initial SQL

    Row-Level Security with Initial SQL

    How to replicate this in your own environment?

    1. Create a free test account on Microsoft Azure
    2. Create a SQL Database on Azure
    3. Install Microsoft SQL Server Management Studio
    4. Follow the instructions on Manoj’s great blog post to:
      1. Create 3 users on the database
      2. Create a new table
      3. Fill the table with content
      4. Setup row-level security on the content
    5. Create the 3 users of step 4.1 on your Tableau Server
    6. Open Tableau Desktop and connect as one of these 3 users to the table you’ve been creating
    7. Create an initial SQL statement like this 
      EXECUTE AS USER = [TableauServerUser] WITH NO REVERT;
    8. Publish the data source – DONE! 😉


    @Manoj: Thank you very much for your blog post around how to setup Row-Level Security on Microsoft SQL Server! You made it very easy to understand the process of setting it up!

  • How to get started to integrate Tableau into your own software solution?

    How to get started to integrate Tableau into your own software solution?

    Which problem does it solve?
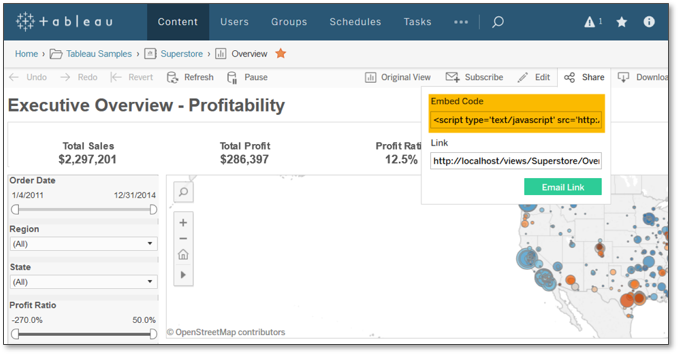
    It solves the problem of finding the right information you need in order to embed Tableau into your own app/application/webpage/wiki/etc.


    How to? 

    1. Install Tableau Server or Start a Tableau Online Trial

    2. Navigate to one of the Sample Dashboards

    3. Integrate this into your application/web page. It’s as easy as putting a Youtube video into a blog

    4. Integrate the same Viz into your application/web page,just more flexible by leveraging Tableau’s JS API

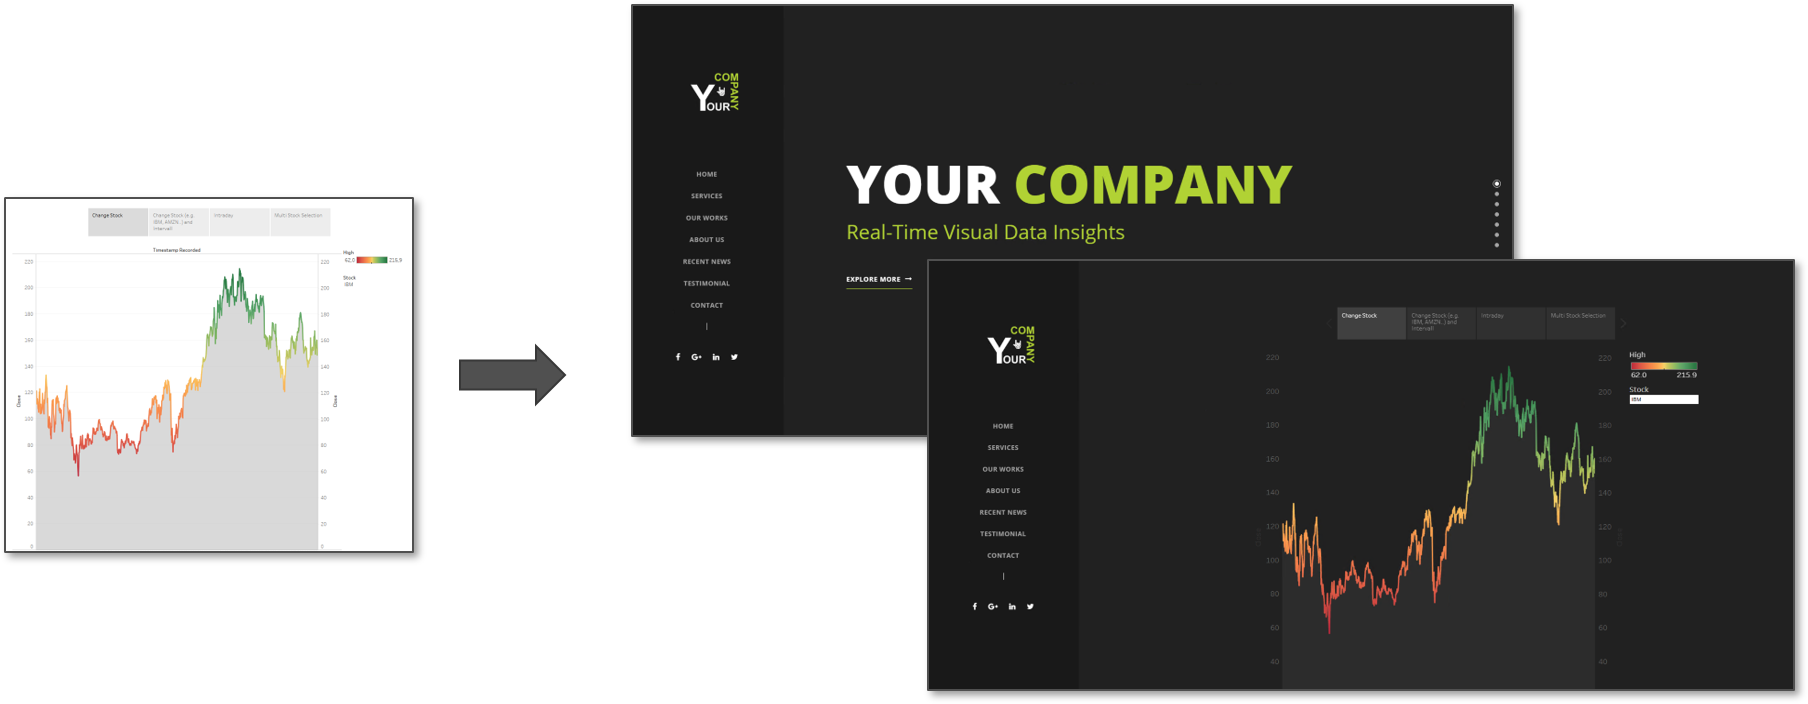
    5. Make it Look YOURS by formatting the Viz according to your corporate look and feel


  • How to save Excel files while Tableau is open?

    How to save Excel files while Tableau is open?


    Which problem does it solve?

    Not being able to change Excel files (e.g. in planning scenarios) while you’re analyzing the very same file within Tableau.


    How to? 


    Links from within the video?

    All Tableau Drivers
    Microsoft Access Driver (for 2018.2)
  • Tableau Server – How to see who deleted a workbook?

    Tableau Server – How to see who deleted a workbook?

    Which problem does it solve?
    To figure out why content doesn’t show up anymore. Did a user delete it? Has it been a Tableau Server administrator job (REST API / TabCmd)?

    Can I use this for my Tableau Server environment?
    Yes, if you’ve got access to the Tableau Server repository on Postgres.

    How to? 

    SQL Statement from within the video?
    SELECT ‘User named: ‘ || a.name || ‘, Deleted workbook: ‘|| b.name as WhoDidIt
    FROM historical_events c,
    hist_users a,
    hist_workbooks b
    where c.historical_event_type_id in
    (select type_id from historical_event_types
    where name = ‘Delete Workbook’)
    and c.created_at > (now() – interval ’24 hour’)
    and c.hist_workbook_id = b.id
    and c.hist_actor_user_id = a.id

    Links from within the video?
    Jeff Krieg’s original post: https://community.tableau.com/message/433508#433508
    How to enable the “readonly” user: Tableau Server Documentation

  • Tableau + SAP BW

    Tableau + SAP BW

    Do you want to combine different SAP BW Queries on a single Tableau Dashboard? Well, having multiple next to each other on a dashboard is not a problem at all, but how can you make them interact with each other? This is exactly what this blog post is going to demonstrate:

    • If you’re working on a single SAP BW Query and you want to filter from one sheet to another you can do this in the the exact same way you’re used to use relational data sources (Use Sheet as Filter)
    • If you’re using 2 different SAP BW Queries, filtering from one to another get’s a little bit more “tricky”
    • The following video shows you how to interact with multiple SAP BW Queries on a Single Tableau Dashboard.


    1. Option: Normal Action Filter
    This works if both Queries are using the same unique remote name (Tableau terminology; Right click on a dimension within the Data Pane in Tableau Desktop -> Describe Field)
    e.g: [0D_NW_CNTRY].[0D_NW_CNTRY].[LEVEL01]

    2. Option: URL Action
    The problem here is that this will open up a new tab if you don’t follow a “workaround” like:  Opening dashboard links in same browser window

    3. Option: URL Action + Web Page Object
    This is my preferred solution so feel free to directly jump to min 3:35 of the tutorial video above


    Download the workbook here:
    Tableau + SAP BW (Filter options on 2 seperated Queries)
    (The ZIP file does just contain the *.twb file. I was trying to use SAP BW sample queries only. I’m interested to hear if they work for everyone once you’ve changed

    • TABLEAUSERVER to your <YOUR TABLEAU SERVER URL> and
    • the SAP BW connection to your testing environment


    Cheers,
    TT

  • Clustering – How to get ranges?

    Clustering – How to get ranges?

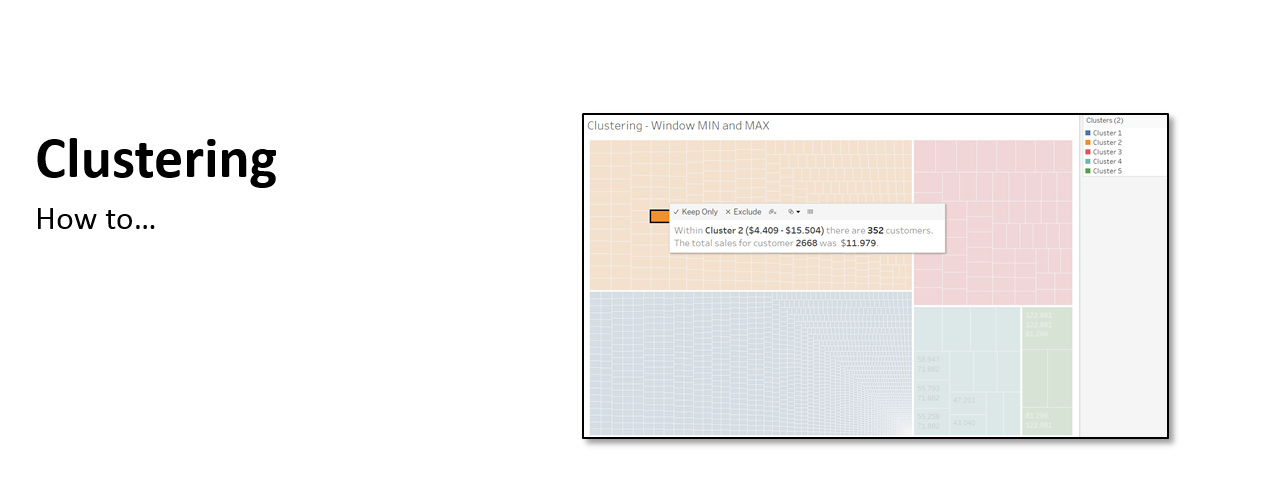
    This video demonstrates how to get the smallest and the largest value within each cluster:

    More detailed information on what happens within Tableau’s clustering algorithm can be found on Bora’s awesome blog post over here

    The official documentation can be found here

    Tableau Public Viz:

  • Tableau 10.0 – Custom Territories im Detail

    Klopf, klopf… Wer ist da? TABLEAU 10.0 steht vor der Tür und es bringt viele neue Sachen!

    Geografische Darstellung bis 9.3

    Dies ist in Summe mein zweiter(!) Blog meines Lebens und dieser Umstand macht das Thema sogar noch interessanter als es eh schon ist. Tableau 10 bringt eine Funktion mit, die es erlaubt, ein noch tieferes Verständnis von geografischen Daten zu bekommen. Jeder kennt bereits die Möglichkeit der Zuordnung geografischer Rollen innerhalb von Tableau. Diese Funktion war bis dato schon gigantisch, da es einfach Länder, Bundesländer, Kreise, Städte und unterste Postleitzahlengebiete nicht nur als Punkte, sondern auch als Polygone automatisch, dank der eingebauten Geo-Datenbank, auf einer Landkarte anzeigen konnte.

    BOOM… Geografische Darstellung ab Tableau 10.0

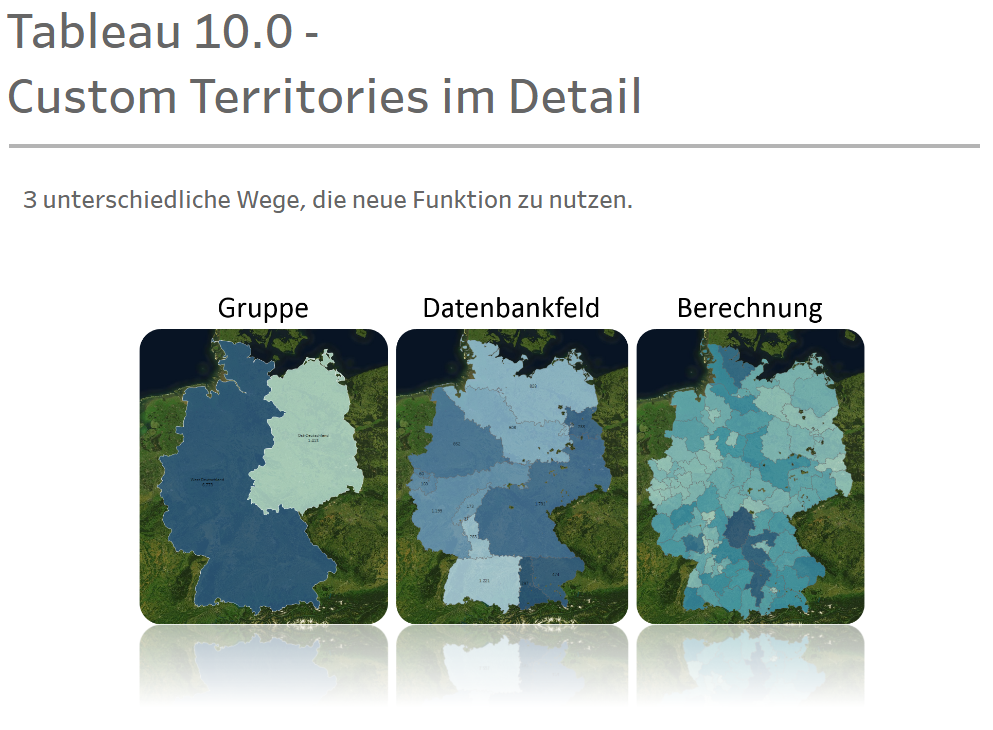
    Tableau 10.0 bietet die Möglichkeit, eigene Gebiete (custom territories) auf einer Karte zu visualisieren. Wenn man den Blogs von Tableau oder anderen Bloggern bzgl. der Version 10.0 gefolgt ist, dann ist das Feature bereits bekannt. Über die Karte lassen sich eigene geografische Gruppen herstellen. Was ist aber, wenn bereits eine geografische Gruppierungsinformation, wie Vertriebs- oder Einzugsgebiete, bereits in der Datenbank existieren oder die Gruppierung auf Basis einer Berechnung innerhalb von Tableau stattfinden soll? Auch daran haben die tüchtigen und kleveren Entwickler von Tableau gedacht.
    Auf Tableau Public liegt ein Workbook mit eingebetteten Video, das alle 3 Varianten abdeckt.


    CT_cover

  • How to create a fancy rank evaluation viz?

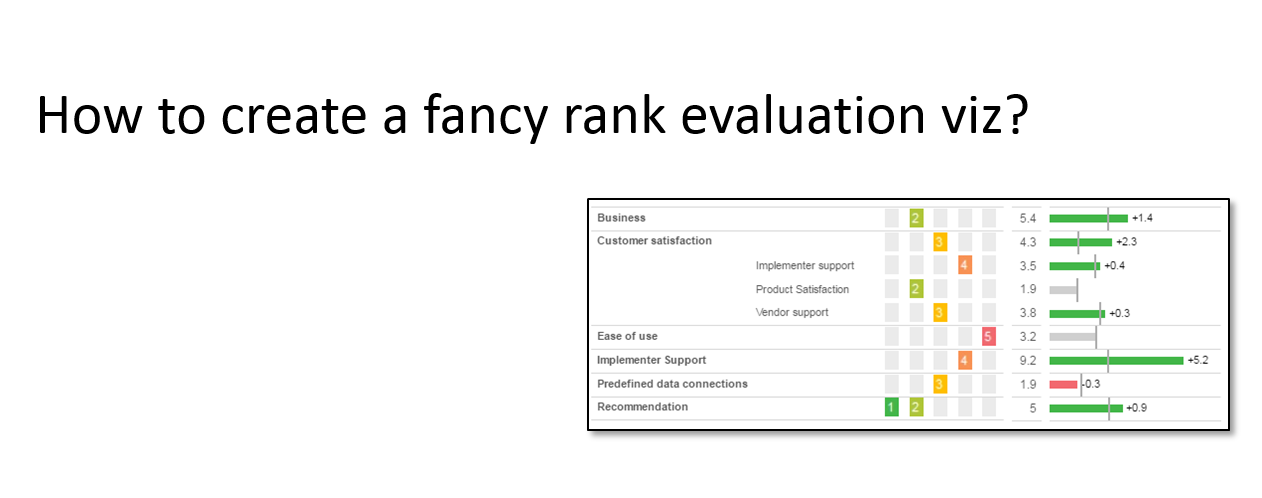
    How to create a fancy rank evaluation viz?

    This is a quick tutorial as an iPhone optimized view on how to create something like this:


  • How to transform street data into geocodes

    How to transform street data into geocodes

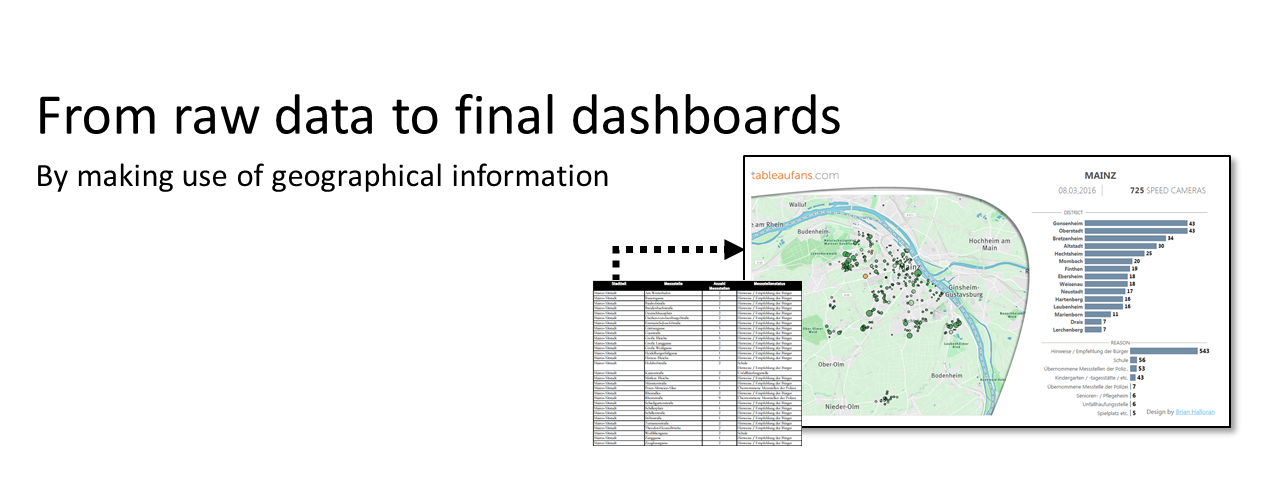
    Today I want to share with you some ideas around transforming raw data into something more visual and valuable. The video below is demonstrating:

    1. Copying data containing street names from a PDF
    2. Pasting this into a free online tool (Batch Geocode) to get LAT and LONG
    3. Saving the result as a CSV
    4. Connecting Tableau with this CSV
      1. Setting the delimiter right
      2. Setting the text qualifier right
      3. Explain how to solve “.” and “,” issues when working with flat files
      4. How to leverage data source filters
    5. Plotting results on a map
    6. Extract information via SPLIT and RIGHT calculations
    7. Visual grouping
    8. Final interactive dashboard


    Links from within the video:

  • Ad-hoc Analysis as Tableau Server User

    Ad-hoc Analysis as Tableau Server User

    Anbei ein kurzes Tutorialvideo das demonstriert wie Sie als Tableau Server User (Interactor) einen neuen Ad-hoc Bericht erstellen können ohne auf bereits existierende Berichte zugreifen zu müssen.

  • Starting a Tableau Presentation

    This video demonstrates 3 different ways of how you can actually start a presentation about a Tableau related topic:

    Click on this link for the sample dashboard on Tableau Public.

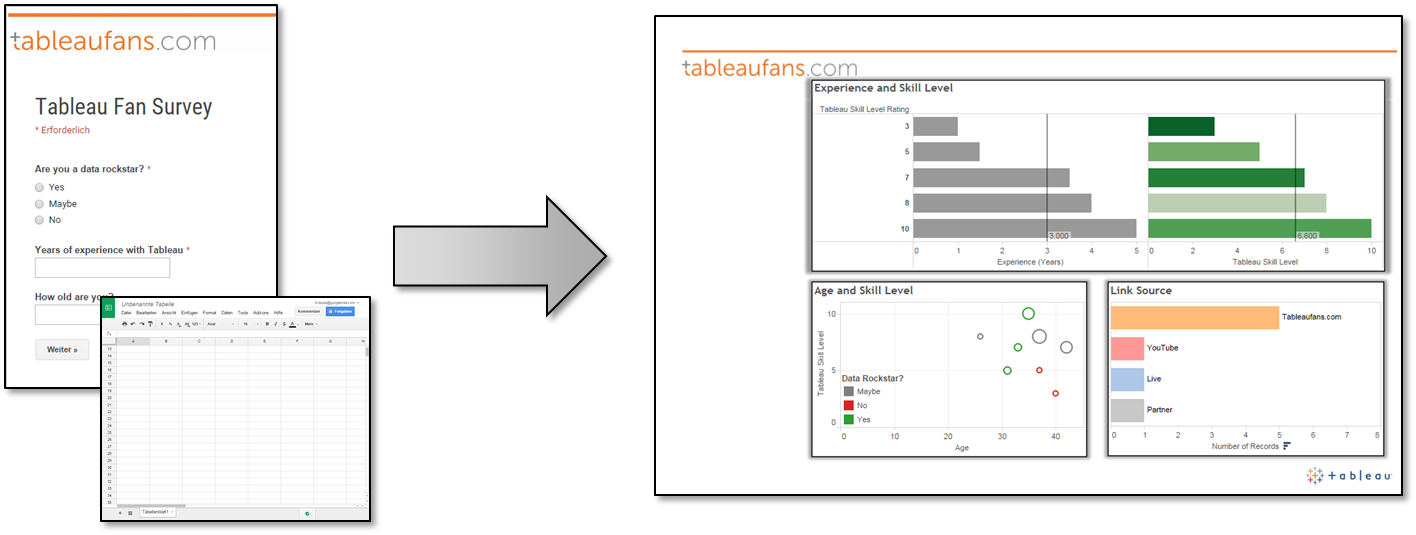
  • Google Sheets & Google Forms

    Google Sheets & Google Forms

    Deutsch

    Anbei ein Video, dass demonstriert wie ich mich mit Tableau und einem ODBC Treiber live zu einem Google Spreadsheet verbinden kann.


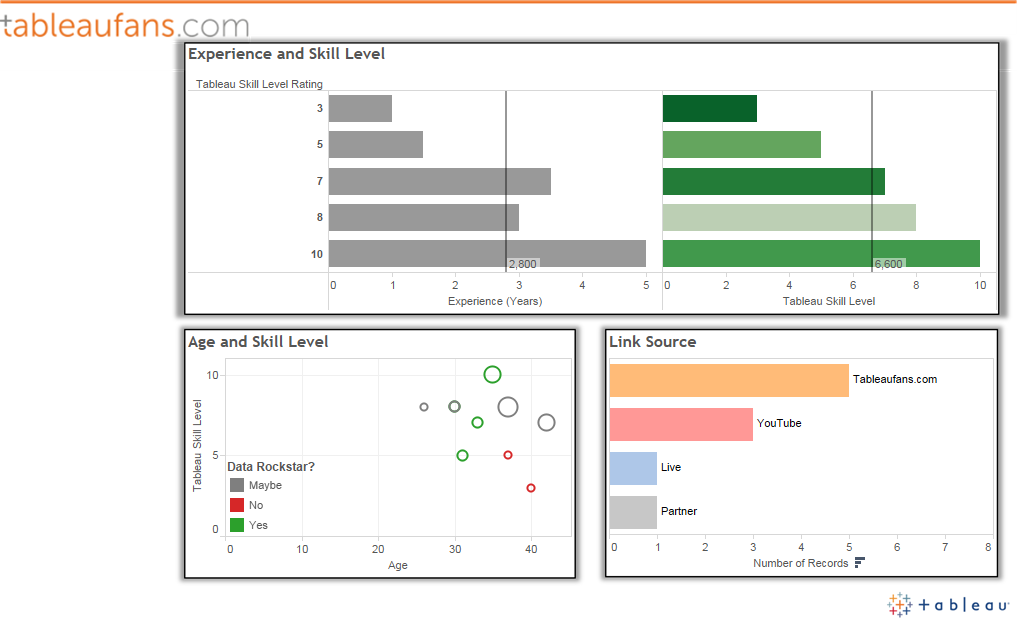
    Das Ergebnis aus dem Video mit dem Link zu Tableau Public:

    Google Sheets & Google Forms iPad

    English

    This video demonstrates how you are able to connect Tableau with a Google Spreadsheet using a 3rd party driver.


    The result from the video including the link to Tableau Public:

    Google Sheets & Google Forms iPad


  • Ihr Datenlein kommet, o kommet doch all!

    Ihr Datenlein kommet, o kommet doch all!

    “Ihr Datenlein kommet, o kommet doch all. Zur Datenauswertung in Tableaus Stall

    … und wenn ihr nicht kommt? Dann hol ich EUCH! 

    [accordion]
    [acc_item title=”Intro”]

    Willkommen zu meinem ersten Blog in meinem ganzen Leben. Ich hätte nie gedacht, dass ich auch mal unter die Autoren gehe, aber sag niemals nie, denn man weiß nie, was kommt und welche Biegungen in einem Leben genommen werden.

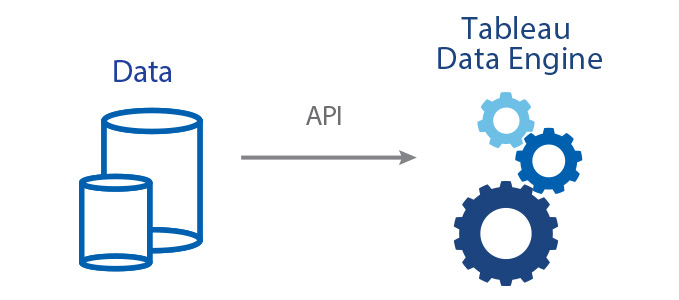
    In diesem Beitrag geht es um die Tableau Data Extract API (TDE API). Seit meinem Beginn bei Tableau Software habe ich mich über die modernen Daten-Konnektoren hergemacht. Wie es aber manchmal so in der realen Welt ist, kommen einen auch mal nicht alltägliche Datenquellen um die Ecke, die selbst Tableau noch nicht kennt. Im schlimmsten Fall Eigenentwicklungen. Um diese ebenfalls berücksichtigen zu können, wurde von Tableau mit der Version 8.2 die Tableau Data Extract API kostenlos zur Verfügung gestellt.

    Die API ist eine von aktuell 3 Schnittstellen. Zusätzlich gibt es noch die JavaScript APIv2, die Timo bereits kurz vorgestellt hat (Blog), und die REST API, die es erlaubt, über ein REST Interface (Tutorial) administrative Tableau-Aufgaben von außen zu steuern.

    Die API wird nicht nur von angeboten, um Kunden oder Partner in die Lage zu versetzen, Daten aus Quellen zu extrahieren, sondern werden auch von Technologie Partnern, wie Informatica, Adobe Analytics und Alteryx als Ausgabe Format generiert.

    [/acc_item]

    [acc_item title=”Aufbau der TDE API”]

    Die TDE API bietet die Download-Option von Programm-Bibliotheken (32bit/64bit) für C/C++, Java und Python. Diese können unter Windows in die eigenen Entwicklungsumgebungen eingebunden werden. Die extra einfach und schlank gehaltene Bibliothek beinhaltet folgende Klassen:
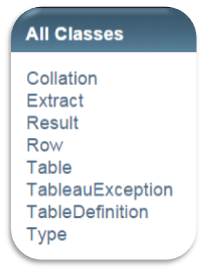
    TDE API Classes

     Neben dem Verbindungsaufbau zum Quellsystem und dem Empfang der Quelldaten, hat die Erstellung der TDE Datei in der Regel den gleichen Aufbau.

    [list type=”check”]

    • Extract Objekt öffnen, um eine neue Datei zu erstellen
    • Tabellendefintion definieren
    • Extracttabelle hinzufügen
    • Zeilen einfügen
    • Alle Objekte schließen

    [/list]

    Nach der Installation befindet sich im Falle von Java ein docs-Verzeichnis ein JavaDoc ist. Hier können die Atribute und Methoden der einzelnen Klassen eingesehen werden. Wollen wir das ganze an einem praktischen Beispiel kurz durch durchgehen. Next section please!

    [/acc_item]
    [acc_item title=”Lösungsbeispiel WebService”]

    Das Viz-Ergebnis, des Extrakts kann man schon in fertiger Form im Blogpost (Kennzahlen mittels Treeselektor auswählen) von Timo sehen. Wie hat er einen Webservice angebunden? Ziemlich einfach. Die EZB biete eine REST-API an, über die europäische Statistiken abgegriffen werden können, wie dieser hier: EZB WebService.

    In JAVA einfach den Webservice über eine HttpURL Connection abholen und den Stream in ein XML Dokument umwandeln, so
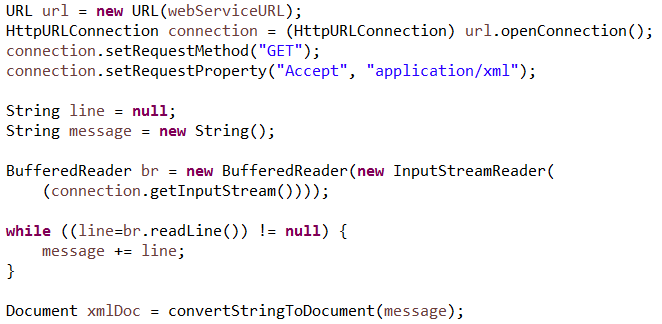
    callWebservice


    In einem XML Dokument Objekt ist es sehr einfach die Bereich zu ermitteln, per Schleife auszulesen und in einem temporären Objekt (falls gewünscht) zu speichern. Diese Schritte haben noch nichts mit der TDE API zu tun.

    Die TDE API kommt jetzt ins Spiel und zwar in genau der Reihenfolge, wie bereits oben erwähnt. Wie erstellen und öffnen uns als erstes ein Extrakt Objekt. Wobei sPath die Variable des Erstellungsortes darstellt.

     Extract

     Als nächstes benötigen wir eine Tabellendefinition. Der Webservices beinhaltet 5 Spalteninformationen, die es wert sind, auszuwerten. So legen wir ein Objekt der Klasse TableDefinition an und fügen 5 Spalten mit denweiligen Datentypen an. Die Spaltennamen sind im abgebildeten Fall in einem Array colNames hinterlegt.

    Tabellendefinition


    Nun sind wir auch fast fertig. Nachdem wir das TableDefinition-Objekt erhalten und definiert haben, fügen wir nun eine Tabelle mit dieser Definition hinzu und öffnen es:


    openTabe

    Nachdem wir nun auch noch eine Zeile mit derselben Tabellendefinition erzeugt haben, durch laufen wir ein 2-dimensionales Array, welches den Inhalt des Webservice widerspiegelt. Am Ende jeder Schleife wird die eine Zeile in das Extrakt-Objekt hineingeschrieben. Dieser Prozess kann abhängig der zu durchlaufenden Schleifen, mal mehr mal weniger Zeit in Anspruch nehmen.
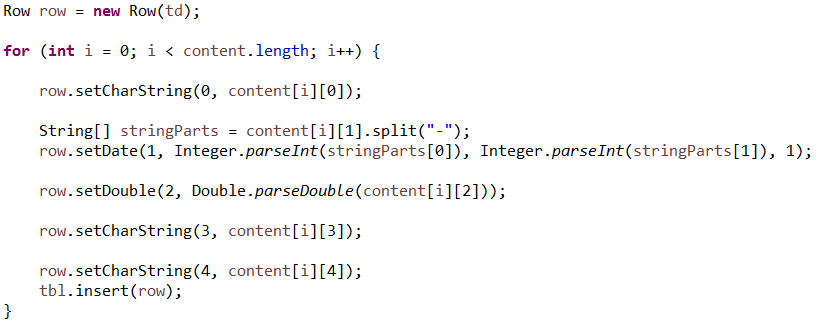
    InsertRows


    Am Ende müssen wir das erstellte Extrakt nur noch schließen.

    CloseExtract

    Jetzt stehen und die Daten in eine Tableau Data Extract Datei für die Analyse zur Verfügung.

    [/acc_item]

    [/accordion]

    Kommentare, Fragen, Anregungen sind herzlich willkommen.

    Im Namen aller Beteiligten von Tableaufans.com wünsche ich eine besinnliche Weihnachtszeit und einen guten Rutsch ins neue Jahr…

  • SAP BW Extrakte Erstellen und Zusammenführen

    SAP BW Extrakte Erstellen und Zusammenführen

    Anbei ein gut 6 Minütiges Video, dass das Erstellen und Zusammenführen von Extrakten auf Basis von SAP BW demonstriert.

    Fragen und Anregungen sind wie immer herzlich Willkommen!