As the term Internet of Things (IoT) is climbing up on many “hype cycle hills” more and more companies are starting to leverage the data each and every device is creating. By being involved in helping start-ups, medium-sized and enterprise companies to making sense out of their IoT data you can definitely see that a lot of requirements in this area are very similar! Even if the device types, data volumes, back-end systems as well as the distribution of the knowledge gathered within the analysis can vary a lot – certain aspects are being asked all the time!
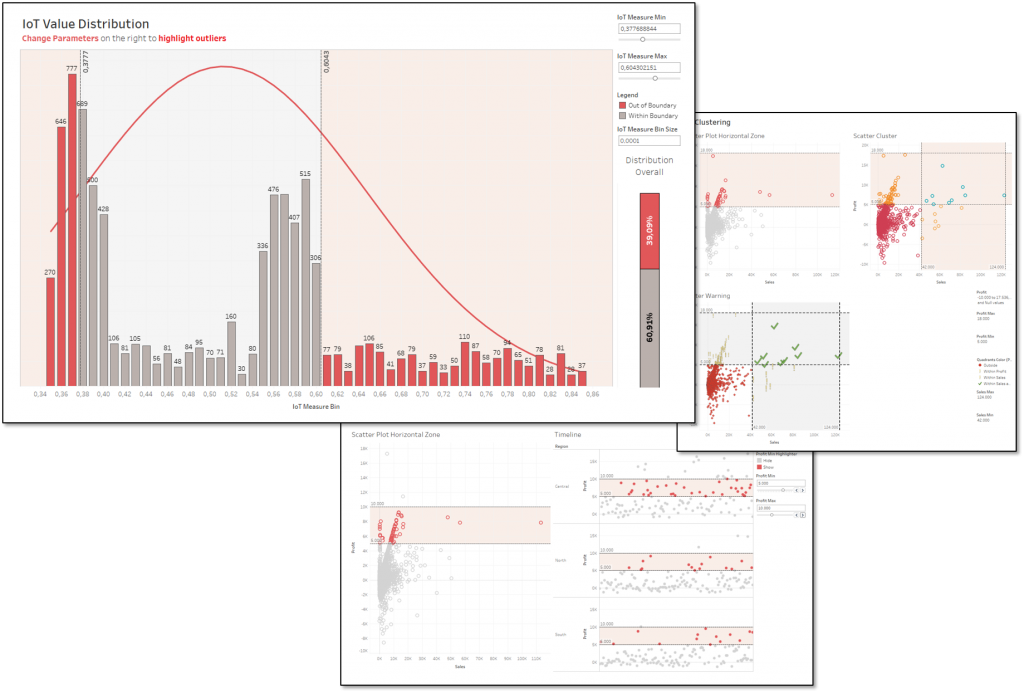
This very short blog post initiates a new category called IoT. It deals with some of the most frequently asked questions in this area. Today I want to share a workbook as an output of a meeting with an enterprise client this morning where we’ve answered the following questions in a visual way right during the their asks:
- How to plot normal distributions?
- How to deal with zooming, highlighting and filtering?
- How can custom parameters help in this context?
- How to figure out the amount of data being analyzed within and outside of a defined range?
- Hot to create reference lines and bands?
- How to setup reference bands on histograms (bins)?
(Simply convert your “Bin” from Discrete (Blue) to Continuous (Green) )
As you can’t answer every question with one sentence I’m going to share the workbook created below. I hope by playing around with the parameters on the dashboard you get inspired to integrate them in your dashboards, too! 😉
Do you want to get the workbook? Simply click on the picture below! 🙂


Leave a Reply