Deutsch
Dynamische Unternehmensberichte Teil II
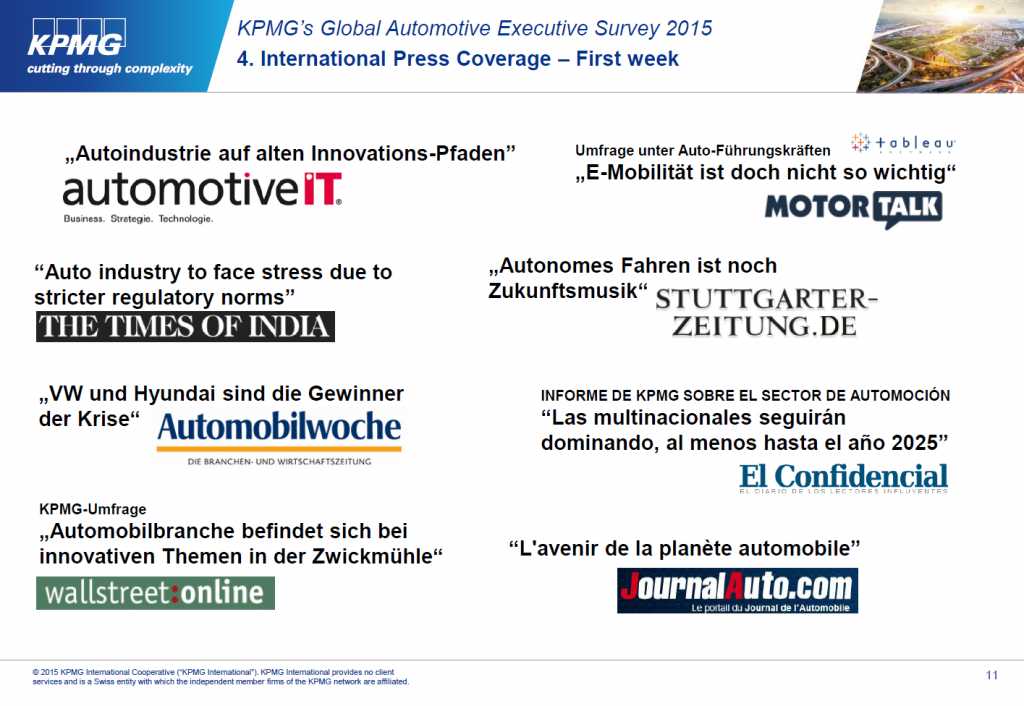
Vor einiger Zeit habe ich etwas zum Thema “Dynamische Unternehmensberichte” gepostet. Heute will ich ein sehr gelungenes Beispiel teilen, dass KPMG kürzlich veröffentlicht hat. Seit 16 Jahren publiziert KPMG die “Global Automotive Executive Survey”. Dabei wird die Publikation in mehr als 100 Märkten weltweit veröffentlicht – überall dort, wo KPMG in der Automobilbranche präsent ist. Die “Global Automotive Executive Survey” ist die weltweit am meisten zitierte Publikation die KPMG jährlich veröffentlicht.
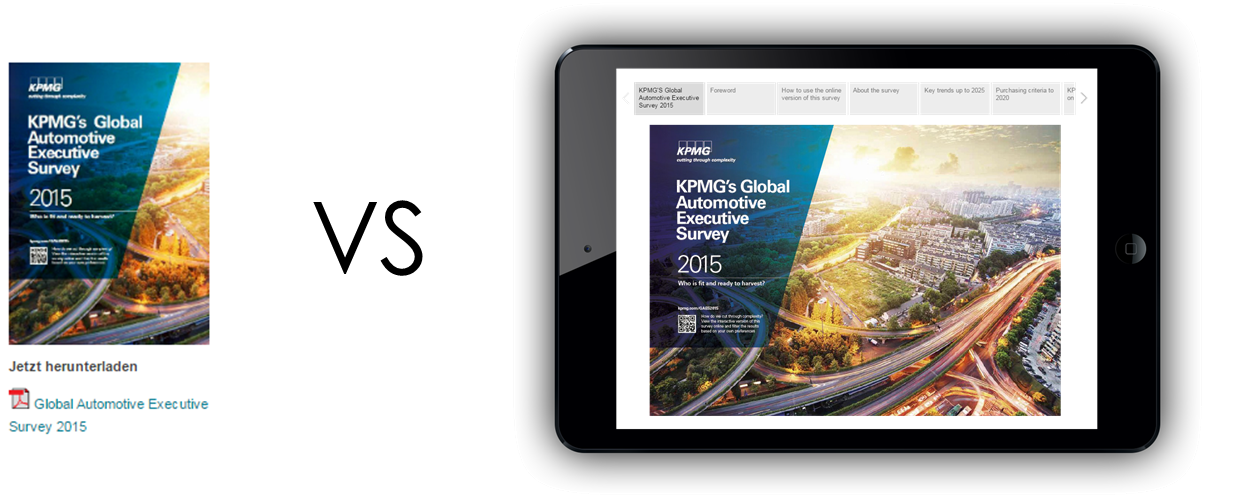
Inhaltlich geht es in der Executive Survey um bevorstehenden Trends und Veränderungen der Automobilbranche. Diese werden von KPMG umfassend analysiert und ausgewertet. In der Vergangenheit wurde der Bericht als „50 Seiten PDF Dokument“ auf der Homepage zum Download angeboten. Dieses Jahr wollte KPMG den Bericht moderner veröffentlichen – noch relevanter für jeden einzelnen und dazu zeitgemäß. Hierbei kam Tableau ins Spiel.
Wie ging es weiter?
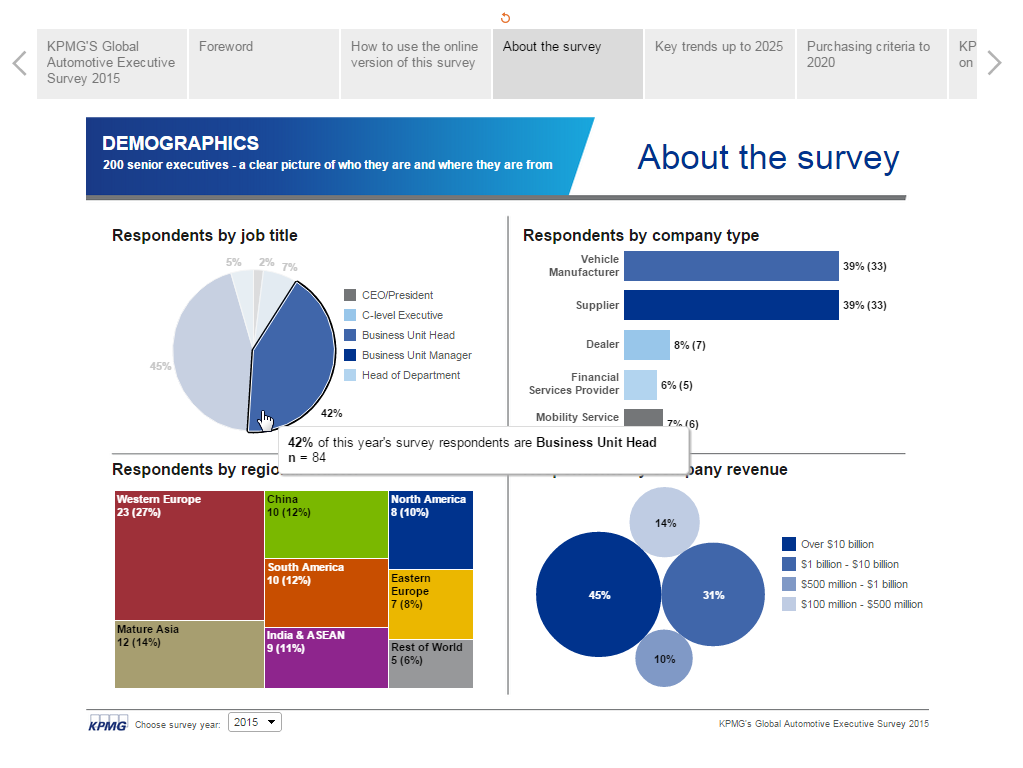
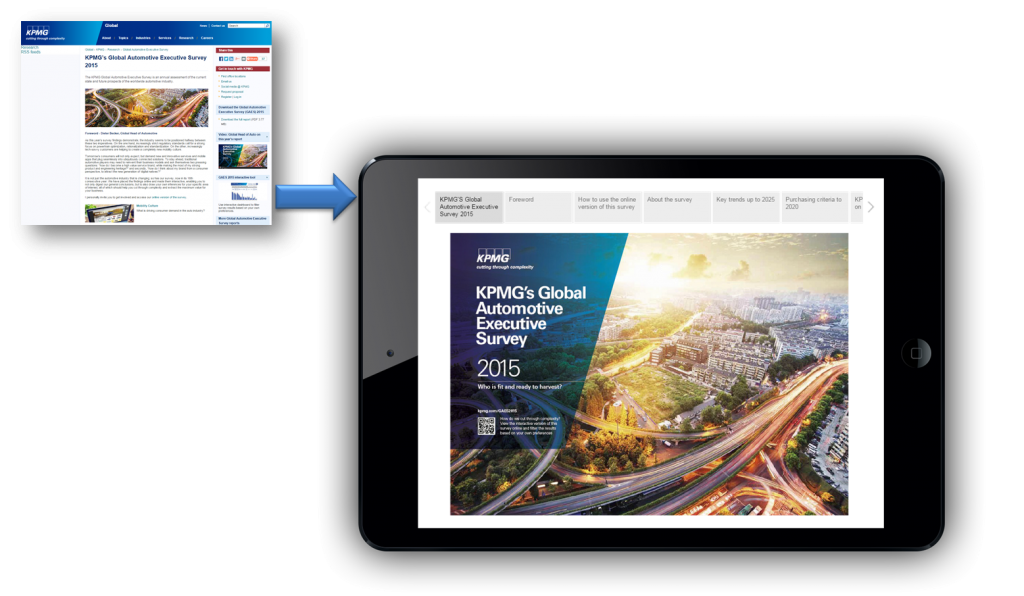
Moritz Pawelke, seines Zeichens „Global Executive for Automotive & Manager of KPMG’s Global Competence Center Automotive“ ist Ende 2014 persönlich an Tableau herangetreten. Man könnte annehmen, dass er Tableau damit beauftragen wollte genau diese Vision, eine optisch ansprechende und dynamische KPMG Automotive Survey umzusetzen. Das war jedoch nicht der Fall! Stattdessen war Herr Pawelke bereits Advanced Tableau User und trieb diese Initiative persönlich voran. Mit “persönlich” ist in diesem Fall tatsächlich er in Persona gemeint! Er war bereits so vertraut mit Tableau, dass er sich sich lediglich um Details erkundigte. Er fragte nach weiteren Ideen und Möglichkeiten wie man in Tableau zu den gewünschten Zielen gelangen könne und erstellte schließlich, quasi im Alleingang das, was Sie bereits in der Überschrift kurz gesehen haben: eine interaktive Version der Global Automotive Executive Survey 2015 auf Tableau Public.
Ergebnis
Es war und ist mir eine Freude mit Herrn Pawelke zusammen zu arbeiten! Er verkörpert “Self-Service BI” wie kaum ein Zweiter in seiner Rolle als Global Executive. Obwohl das Ergebnis für sich spricht so bin ich mir sicher, dass er vorab viel Überzeugungsarbeit leisten musste um diesen “Neuen und Unbekannten” Schritt in Richtung eines Mediums zu gehen, bei der der Enduser nicht nur durch den Bericht navigieren kann, sondern selber auswählt, was für Ihn relevant ist!
English
Interactive Company Reports Part II
A couple of weeks ago I posted something about “Interactive Company Reports“. Today I’m going to share a great example of one of our clients who realized something like this – KPMG. For the last 16 years KPMG has published the “Global Automotive Executive Survey”. KPMG publishes it in all 103 markets where they drive business in the automotive market and it is translated into many different languages (including Korean, Japanese, Czech and many more). A third party company confirmed this survey to be the world wide most quoted annual publication KPMG produces!
Within that survey KPMG is analyzing the upcoming trends and changes in the automotive industry. In the past this report was published as a static “50 pages PDF file” which could be downloaded on their homepage. This year KPMG decided to be more State of the Art by becoming more interactive and allowing the consumer to choose which information are relevant to them. This was where Tableau came in.

How did the journey to the final result look like?
„Global Executive for Automotive & Manager of KPMG’s Global Competence Center Automotive“ Moritz Pawelke called Tableau at the end of 2014. One could think that he asked Tableau to realize his vision of an interactive and visual appealing KPMG automotive survey, but this was not the case! He was already an Advanced Tableau User! So the Global Executive for Automotive of a huge company was running the initiative of a new version of their survey on his own. That means Moritz Pawelke was using his own laptop. He had all results from the survey and he was analyzing this data using Tableau by himself!
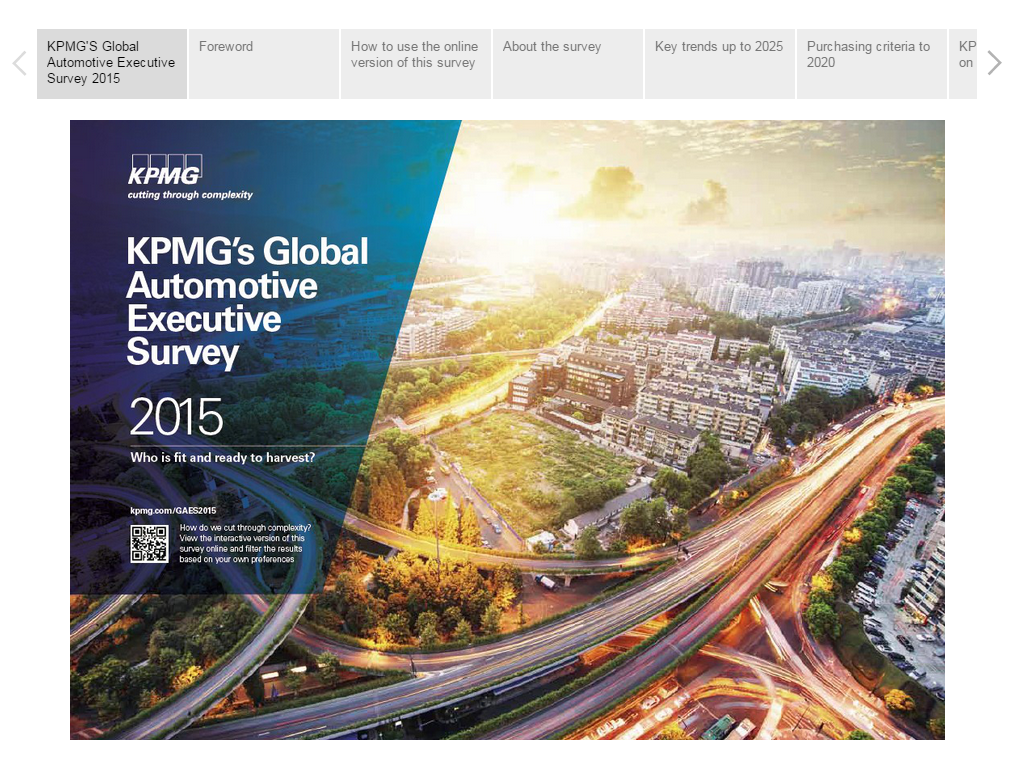
He was already such familiar with Tableau that he was just asking for a couple of calls in order to get some detailed questions answered. So we put our heads together shared some thoughts and ideas of how to realize certain things within Tableau. The final version of the report which you’ve seen in the header was pretty much realized by Moritz Pawelke on his own. An interactive version of the Global Automotive Executive Survey 2015 on Tableau Public.
Result
It was (and still is) a pleasure and a lot of fun working with Moritz Pawelke! He is a leader in how to communicate information with his audience and we just started with the journey of how Tableau can help him with this. He embodies “Self-Service BI” in his role as a Global Executive like very few other people in his position. Even if the result speaks fot itself, I’m sure that this “new and unknown” approach of transfering information was something which took him quite a while to negotiate internally. In my opinion he did a great job and added a lot of value to every consumer who is now able to choose what is relevant for him and what not.

Leave a Reply