Category: Ideas

  • Interactive Time Filter (Parameter Action)

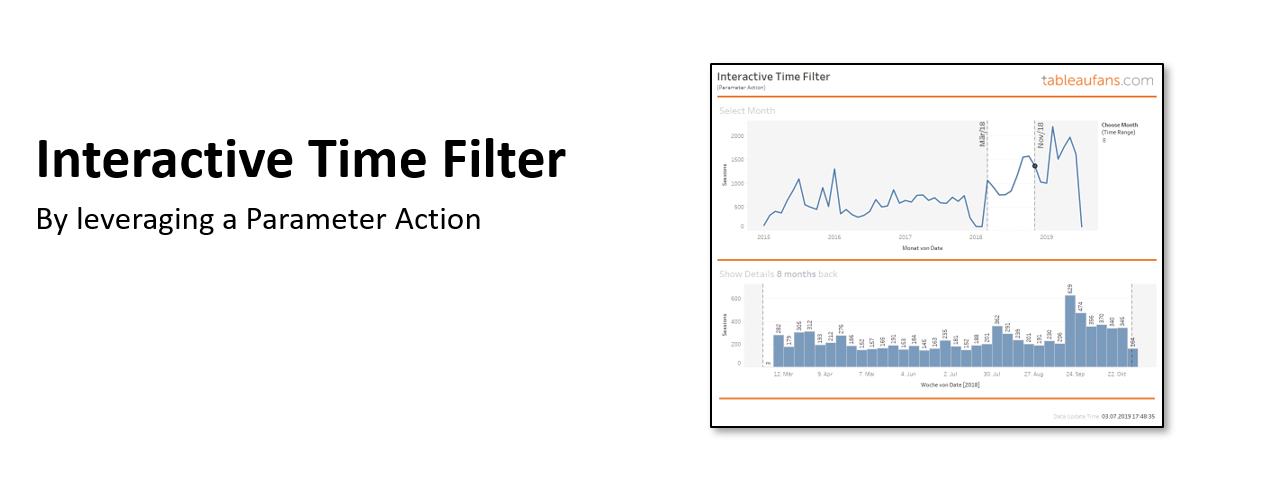
    Interactive Time Filter (Parameter Action)

    FYI: Parameter Actions are available since 2019.2

    Today I’ve been on customer side where they wanted Tableau to have a filter which is able to

    • select a relative date as well as 
    • range of dates


    Ideally this could be chosen by a Tableau Server Viewer interactively by having a simple switch between both. Due to the limitation of:

    • this can only be adjusted within WebEdit/Desktop and
    • there is no switch between both options for end users


    I’ve been coming up with a workaround which might solves some of the issues end users do have out there. It would be great if you could reference this feature request from Tableau’s Ideas Forum. Any feedback to the solution below is highly welcome (positive + negative):


  • Advanced Analytics

    Advanced Analytics

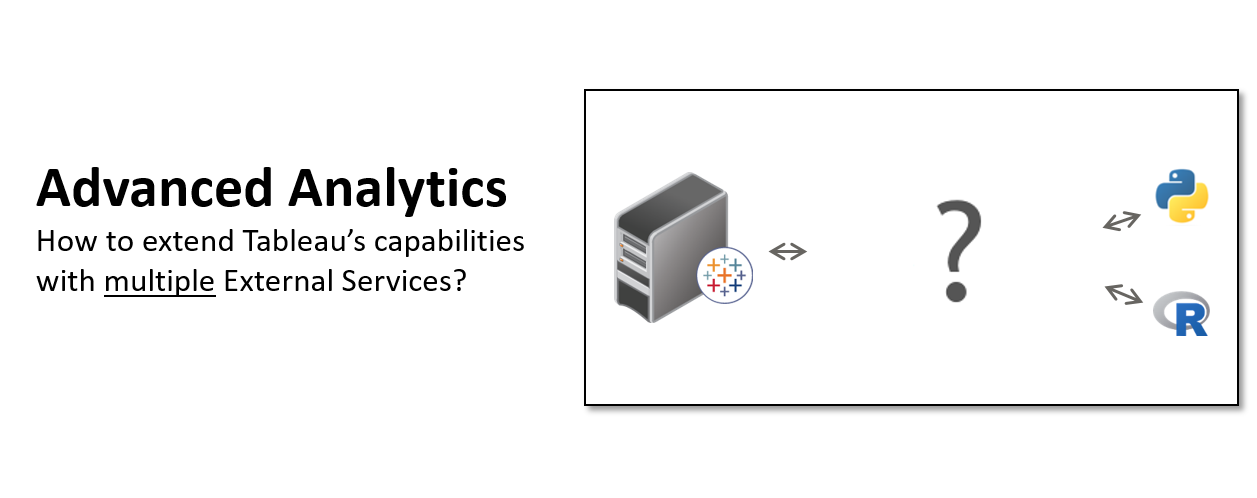
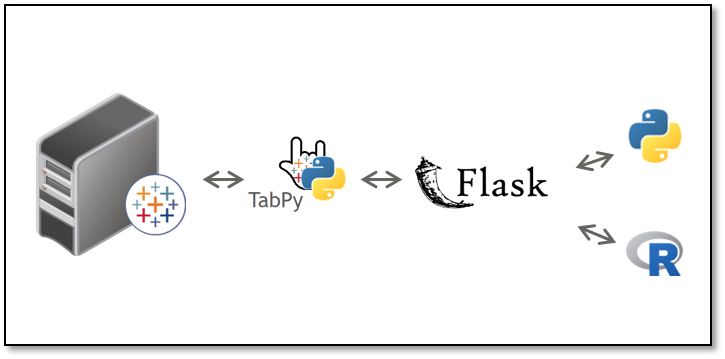
    A very popular post for the many data scientists within the Tableau community has been this blog post around how to setup multiple External Services for Tableau. Therefore this post is meant to be the first follow up post on it. While the initial architectural diagram showed flask as an adapter between TabPy and R as well as Python, Alican Polat slightly adjusted this architecture. Now TabPy acts as a pure web service which routes the traffic to 2 other services in this case Flask or DeployR:

    • Flask (a web framework for Python) &
    • DeployR (allows you to expose R as an analytical web service)


    There are several ways on how you can decide which oh the 2 paths to follow along. One way could be a naming convention for your functions. So if your calculated field calls a function called R_GET_CUSTOMER_CHURNTabPy could decide to forward this web service call down to deployR. On the other hand side the same request could be processed by Python if the receiving web service call within TabPy would process a prefix “P” for Python so that the request P_GET_CUSTOMER_CHURN gets routed to the top right according to the illustration above. You just need to deploy a function within TabPy in order to make this decision! This could be a prefix which you process within an if-then-else statement, a suffix, time of the day, Tableau parameter…

    There is an infinite number of ways on how to decide whether to choose R or Python for the function call. So I just want to demonstrate one more way which would allow the end user to choose between on or the other. The 2nd and last code snipped in this post demonstrates an example which routes the traffic to either a Python or R based on a Tableau string parameter called “service”. It’s values could be predefined to R or PYTHON and set by the front end user of the dashboard. Of course it’s up to the administrator if individuals should have the power of choosing between one or another or if simply the creator of the dashboard should decide it based on the best library per use case.

    So let’s say you’ve already setup TabPy according to GitHub or this German tutorial from Alexander Loth you go ahead and create a calculated field within Tableau. An easy first example to test if you’re getting back a result from TabPy would be:

    SCRIPT_REAL(' 
        import numpy as np 
        return np.corrcoef(_arg1,_arg2)[0,1]
    ', 
    SUM([Sales]), SUM([Profit]) )


    Once this works you can move on by setting up:

    • Lifetimes“, a Python library (which you embed into Flask) to calculate Customer Lifetime Values  and
    • BTYD“, an R implementation of it (on DeployR)


    Within both – R and Python – you can then setup customer churn models. Alican in particular calculates within his models:

    • How likely is it that a customer will continue to buy?
    • How likely is it that a customer is going to buy a certain product?


    On TabPy you need to define a function like the following one where a Tableau string parameter defines if R or Python is going to process the function you’re calling within a calculated field. In this example Python would be installed on the very same machine (localhost:8888) whereas the R service would be forwarded to a different host called myRserver with port 9090.

    def get_customer_product_churn(customer, product, days, service):
        import requests
        if service = ‘PYTHON’
        r = requests.post('http://localhost:8888/lifetime_service', data = {
                                                                            'customer': customer,
                                                                            'product': product,
                                                                            'days': days,})
        if service = ‘R’
        r = requests.post('http://myRserver:9090/lifetime_service_withR', data = {
                                                                            'customer': customer,
                                                                            'product': product,
                                                                            'days': days,})
       
    
        serviceResult = r.json()
        return serviceResult['result']


    I hope this post answers some of the burning questions you – the community – had. Please provide us with any kind of feedback below. I promise it hasn’t been the last blog post around advanced analytics, Python and R! 😉

  • Tableau Photo Booth

    Tableau Photo Booth

    What is it?
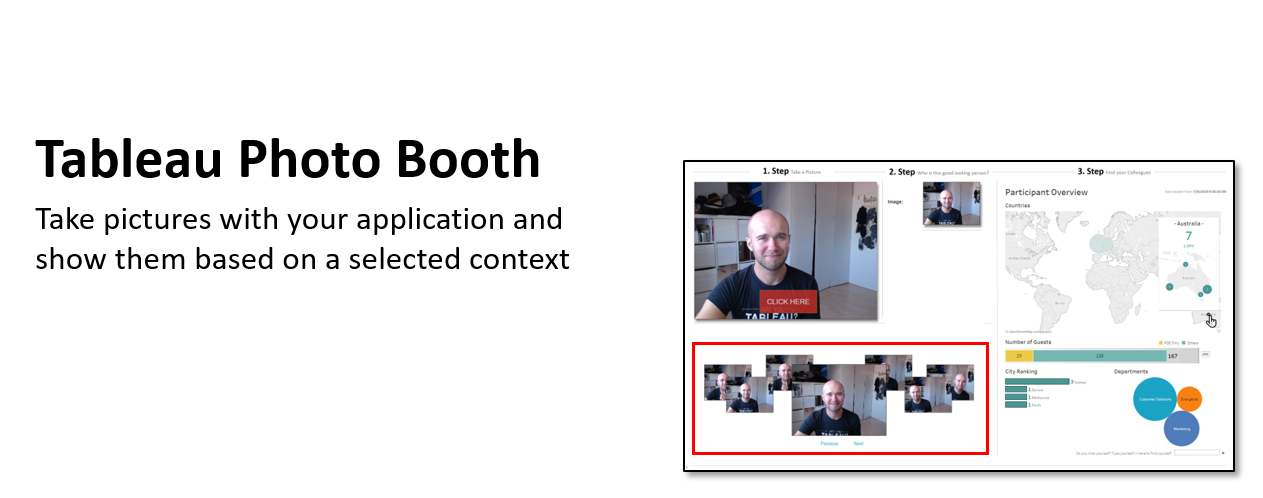
    It’s a web application which visualizes pictures coming from a 3rd party application (Photo Booth) based on selections end users are making on a map (Tableau Dashboard).


    Which problem does it solve?
    It solves the problem of combining Tableau + pictures when you can’t leverage URL-Actions or custom shapes.


    How to use it (End User Tutorial): 


    Can I use this for my internal Tableau Event?

    Sure, just ask your Tableau contact if a consultant can set it up on a Tableau owned laptop. He or she can download XAMPP+TABLEAU PHOTO BOOTH here and when you asked some days in advance you could be lucky and have a Tableau Photo Booth up and running on-site 🙂 Another way of getting it is download it by your own and simply follow the installation instructions below.


    What is it technically?
    It is an application which uses an

    • Apache Tomcat -> As a web server to host the HTML, CSS and JS code
    • MySQL database -> to store data users are submitting
    • Tableau JavaScript API -> to immediately visualize input users are making


    How can I get it?

    Step-by-Step Installation

    Step-by-Step Installation

    1. Download the code from above (XAMPP+TABLEAU PHOTO BOOTH here)
    2. Extract 7-Zip-File into C:\
    3. MAKE SURE PORT 8888 is not in use by another application on your machine
      (Tomcat is configured to use it)
    4. MAKE SURE PORT 3306 is not in use by another application on your machine
      (MySQL is configured to use it)
    5. Start “xampp_start.exe” on C:\xampp as an admin!
    6. Navigate to “C:\xampp\htdocs\TableaufansPhotoBooth” and publish “TableaufansPhotoBooth.twbx” with Tableau Desktop 2018.1 or above
      (when you don’t want to change the embed code simply publish it to your local Tableau Server http://localhost into the “Default” project
    7. Open up “http://localhost:8888/TableaufansPhotoBooth/” within your browser and press F11 (full screen)

    Video Installation

    Video Installation

  • Advanced Analytics

    Advanced Analytics

    Yesterday I’ve had a great meeting with Alican Polat. Alican has got roughly 20 years of experience in the analytics industry!!! The spectrum he covers in this area reaches from architectural design, over SAP, Tableau and other BI front end as well as backend tools, too machine learning algorithms!

    Today I’d love to quickly share an architectural design he came up with throughout this year. As a machine-learning enthusiast, he likes to code R and Python code at the same time. “Depending on the use case there are libraries out there which sometimes are faster in R and other times in Python” he says.

    Based on Tableau’s documentation one could think that you can just use a single External Service like Python and R. The truth is, you can leverage both at the same time if you’re leveraging Alican’s architecture:

    He set up TabPy to communicate with Tableau Server. TabPy is routing every R and Python function to Flask, which simply acts as a proxy. Based on a rules (e.g. naming conventions) Flask decides where to route the request to either R or Python before the result set does get send back to Tableau Server. 

    Side note:

    • Matlab is not used in their current environment and would be interesting to see if Flask could route requests to Matlab, too
    • Julia (=”high-level, high-performance dynamic programming language for numerical computing”) could might be added to this architecture like Alexander Loth describes in his blog post


    If you like this approach please leave a comment below and Alican Polat or myself will make a follow up post with more details about it.

  • Customer Portals

    Customer Portals

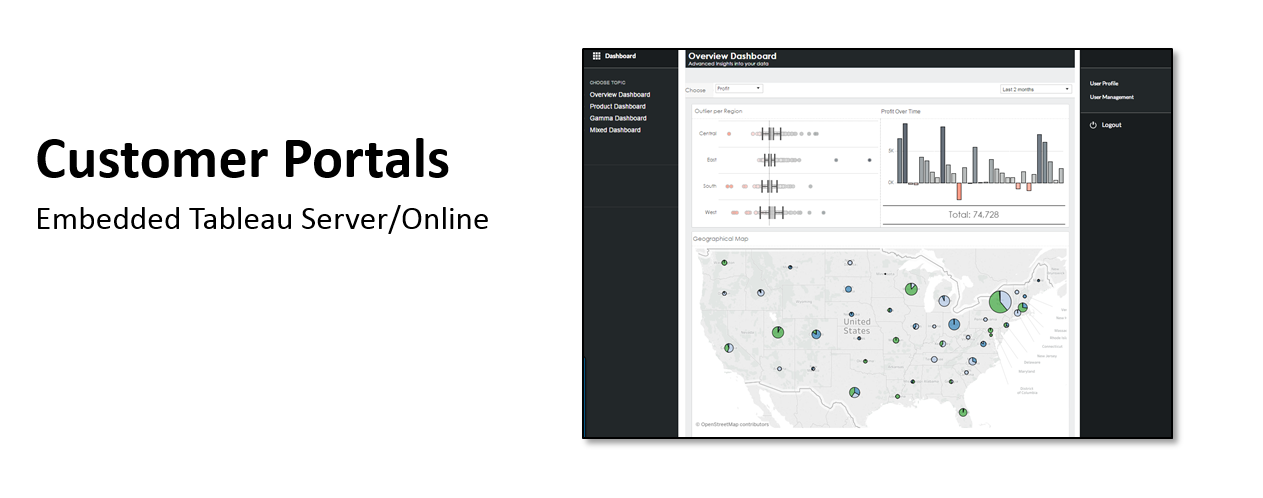
    Embedding Tableau Server or Tableau Online into customer portals is quite a very popular use case and more and more companies are providing Analytics to their clients. There are many ways of doing that and Tableau‘s Community is providing hundreds of great articles and videos around it.

    As I was on customer side in Switzerland this morning to actually talk about it I decided to create this tiny little blog post. It’s basically meant to demonstrate one very basic example of how such an integration can actually look like for an enduser.

    Basic Example for a Customer Portal with Tableau

  • Custom Tableau Demo in 15 Minutes

    Custom Tableau Demo in 15 Minutes

    Today I want to reference a post I made in March 2015. Back in the days I was recording a video about different ways to start a Tableau presentation. A couple of days ago I got invited to give a TechTalk speach at a bank in Frankfurt, Germany. In order to introduce the crowd to Tableau I wanted to do a custom demo. Therefore I was creating a simple Google Form which stores results in a Google Spreadsheet which Tableau can connect natively to since version 10.

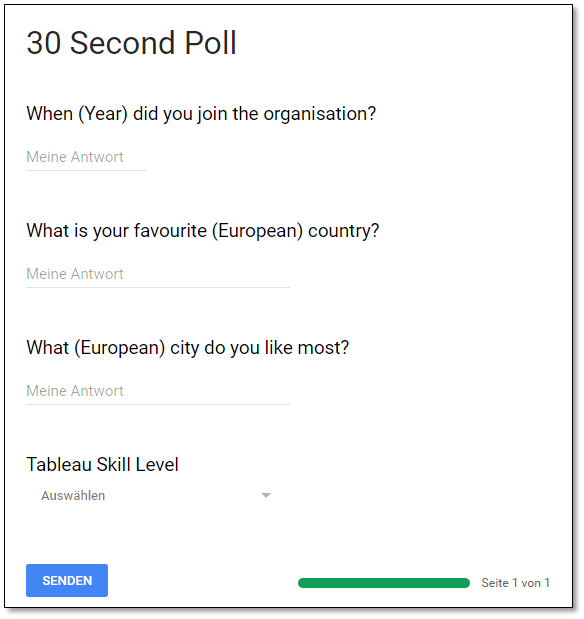
    Questions
    The coolest way to demonstrate the power of Tableau should contain a time information (an exact date would be best!), something geographical and some interesting categories. In order to keep it as simple and fast as possible for the audience to answer my questions I was keeping it as easy as possible:

    Answers
    Answers get stored in a Google Spreadsheet. I was adding a couple of things to the default sheet like:      

    • Date: I was not allowed to ask the exact date when people did join the company. In order to demonstrate Tableau’s powerful TIME capabilities I was randomly adding days and months to the actual year when people joined the company
    • Dummy Data: If for whatever reasons people wouldn’t have been able to answer the questions – this would have been my backup data I produced upfront
    • Company: This column alows me to compare companies (anonymously) during future demos


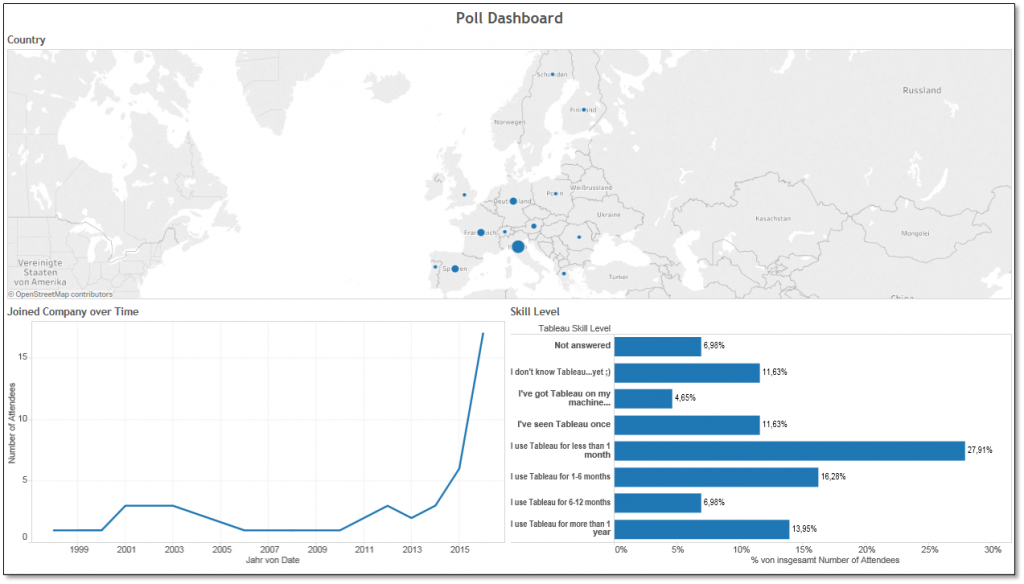
    Outcome
    The best part starts once you take the data and turn it into something meaningful. You can either connect Tableau live to your Google Spreadsheet or simply copy and paste the data into Tableau (which oftentimes creates an even bigger WOW-EFFECT). Whatever you’re coming up with keep in mind that every single drag and drop is already demonstrating the power of Tableau! And while you’re asking questions while you’re already answering them you’ll learn a lot about your audience if you add something like “Tableau Skill Level / How long are you already using Tableau” to one of your questions! This will tell you if you can jump into more sophisticated topics within Tableau or not after you’re “TechTalk / Tableau Day KICKOFF Demo” 😉


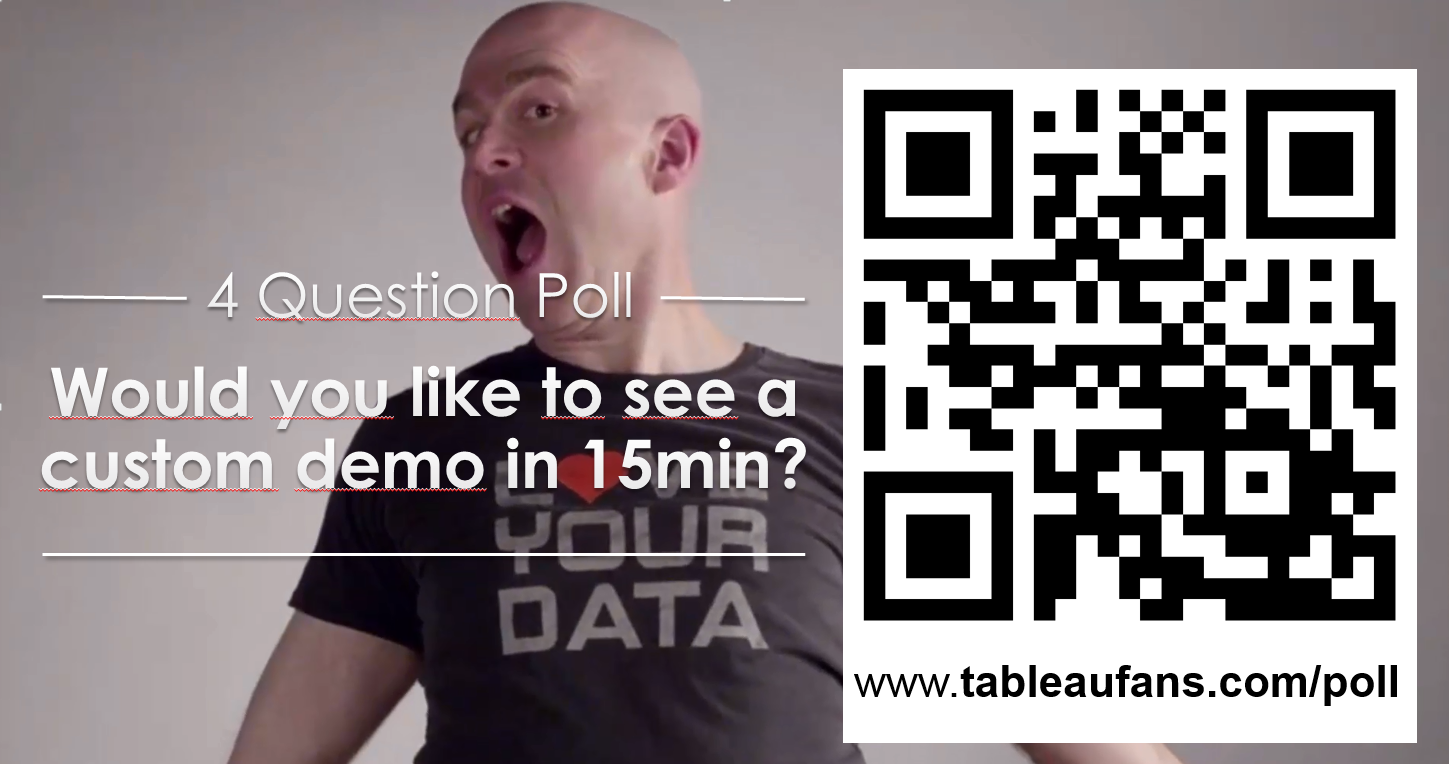
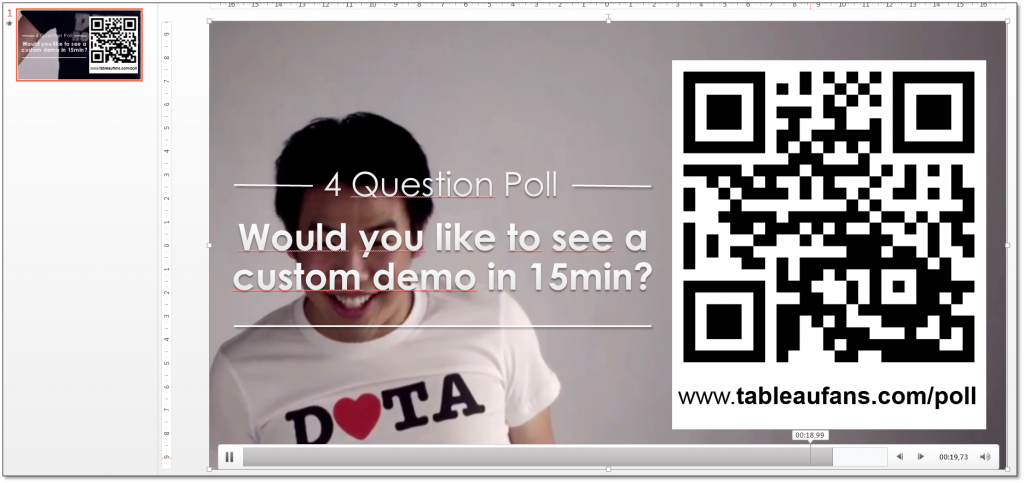
    Last but not least please feel free to download the PowerPoint template with AWESOME TABLEAU COLLEAGUES jumping in the background and customize it to your needs (tons of URL + QR code creators are out there! 😉


    Tableaufans.com – PowerPoint Template – Jumping Tableau Colleagues


  • Visual Statistical Analysis using an unknown dataset

    Visual Statistical Analysis using an unknown dataset

    A couple of days ago a customer reached out to me in order to get a better understand on how we can make sense out of data. He wanted to do some statistical analysis, but we didn’t speak about any details at this point of time. I responded in a way that I asked him to get some real data from him rather than demonstrating this on some dummy data.

    30 minutes prior to the call this morning I realized that he actually sent me some data. So without reading anything about it I wanted to play around with it to get a better understanding of the data prior to the call. The result of these 30 minutes + another 30 minutest for colors, fonts and formatting stuff afterwards can be seen here: