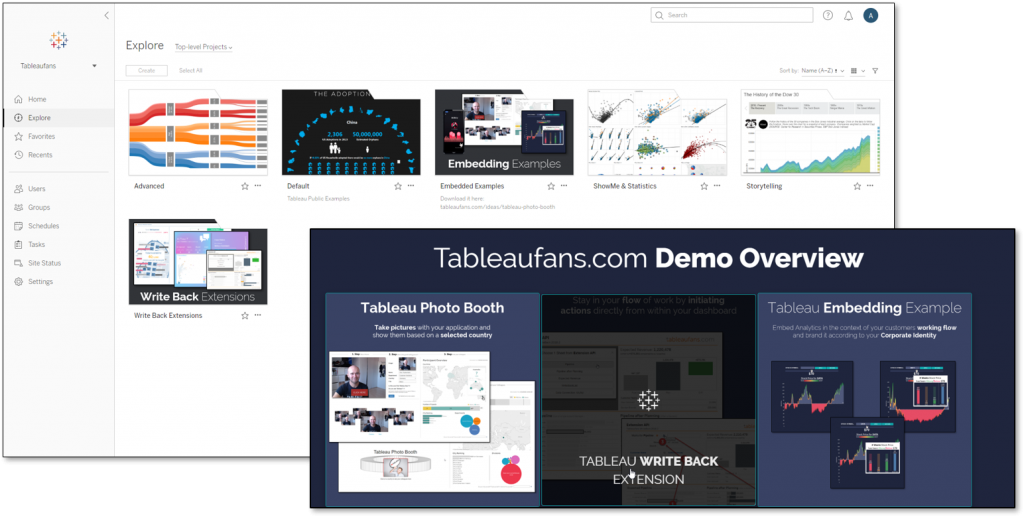
Are you interested in setting up a Proof of Concept kind of environment where you can see embedded Tableau Dashboards in action? If so, please follow the instructions below.
The idea of this asset is to see how Tableau can look like in embedded scenarios, how you can extend Tableau’s capabilities with your own software and to test how Tableau Write Back Extensions can close the loop between analytics and transactional tasks. On top of that it contains a lot of great examples from Tableau Public. This helps you to spread the word around “what’s possible with Tableau” within your organization more easily or simply leverage it for yourself to get inspired! 😉
How can I get it?
Video Installation
Video Installation
System Requirements:
- Windows operating system
- Port 8888 needs to be open/free (Webserver)
- Port 3306 needs to be open/free (MySQL)
- Tableau Server 2018.3 or above
Step-by-Step Installation
Step-by-Step Installation
- Login to a Tableau Server test instance as Tableau Server Admin via your browser
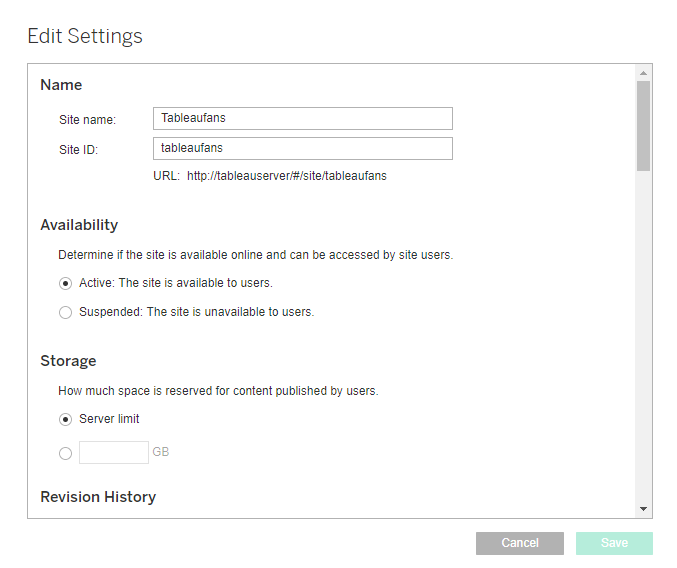
If it does not already on your Tableau Server, create a user “admin” with “Server Administrator” rights - Create a new Site which looks exactly like this!
Site name: Tableaufans (upper case “T”)
Site ID: tableaufans (lower case “t”)
- Download “Tableau Demo Asset” and UNZIP it’s content which contains:
- mySqlDriver.zip (driver for mySql database)
- tableaufans_public_demo_asset_site_v2019.4.zip (Tableau Server Site with great vizualizations)
- tableaufans_public_demo_asset_thumbnails.zip (thumbnails for Tableau Server projects)
- xampp-tableaufans.zip (Webserver + MySQL DB in a single application)
- Copy the zip file called “tableaufans_public_demo_asset_site_v2019.4.zip” into “C:\ProgramData\Tableau\Tableau Server\data\tabsvc\files\siteimports“
- Run the following commands via command line (Tableau Server must be running; official documentation):
tsm login --username YOUR-USERNAME --password YOUR-PASSWORD

tsm sites import --site-id tableaufans --file tableaufans_public_demo_asset_site_v2019.4.zip
- Follow the instructions in the command line window
tsm sites import-verified --id tableaufans --import-job-dir import_XXXXXXXXXXXXXXX
If this succeeded simply open Tableau Server to already see some awesome dashboards of the Tableau community!!!
In order to leverage the full demo asset including embedded Tableau Dashboard examples + Write-Back-Extensions follow the last 2 steps
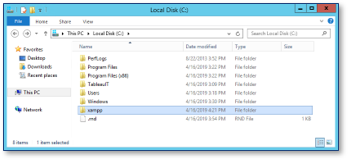
- Go back to the downloaded ZIP file and extract the content of “xampp-tableaufans_v2019.1.3.zip” directly into your C: drive
(Hint: You should then see “C:\xampp” folder or “C:\xampp-tableaufans”)- It contains an Apache web server (needs port 8888)
- It contains MySQL (needs port 3306 – username/pw = admin/admin)
- Tableau’s GitHub Extensions Folder + 3 Tableaufans Extensions
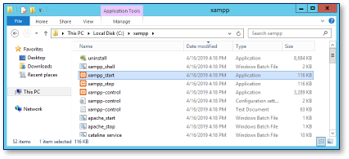
- Start C:\xampp-tablfeaufans\xampp_start.exe as administrator
- Open up a browser (I tested it with Google Chrome) and type in “http://localhost:8888”
- Go back to the downloaded ZIP file –> extract the MySQL drivers and install them
- DONE!
P.S. If you’d like to have the same nice little thumbnails per project as you can see within the installation video or the blog post image just go back to the downloaded ZIP file and extract + copy the content of “tableaufans_public_demo_asset_thumbnails.zip” into “<YOUR-PATH>Tableau Server\data\tabsvc\httpd\htdocs”.
Troubleshooting
Troubleshooting
Before you’re looking into this section I encourage you to watch the installation video (if you’ve been following the step-by-step guide) as this demonstrates each and every installation step and how it worked on a blank AWS VM.
Troubleshooting – Importing Site:
- Make sure you run the “tsm sites import-verified –id tableaufans –import-job-dir import_26124ec_2019XXXXXXX” command!
- If you’ve done this and it didn’t work:
- Delete the “tableaufans” site
- Restart your computer repeat to follow the instructions from top (it makes sure that noting interferes Tableau Server and your import process)
- Make sure you’ve logged out all active users from Tableau Server and closed all browser windows prior to importing the site
- Make sure you’ve closed all Windows windows + all CSV files prior to the “tsm sites import-verified” command
- If this didn’t help you to import please check the latest import/export site documentation
- If nothing helps please post a comment below so that the community can help you out
Troubleshooting – Starting Xampp:
- Make sure required ports are open
- Make sure UAC is not active
FYI
P.S. Database User/Password are both “admin/admin” for all examples where workbooks leverage the MySQL database on Xampp you’ve been downloading above. You can have a look at the tables being used via http://localhost:8888/phpmyadmin/db_structure.php?server=1&db=tableaufans

