Category: News

  • Tableau Conference – Fun Session about Embedding Tableau

    Tableau Conference – Fun Session about Embedding Tableau

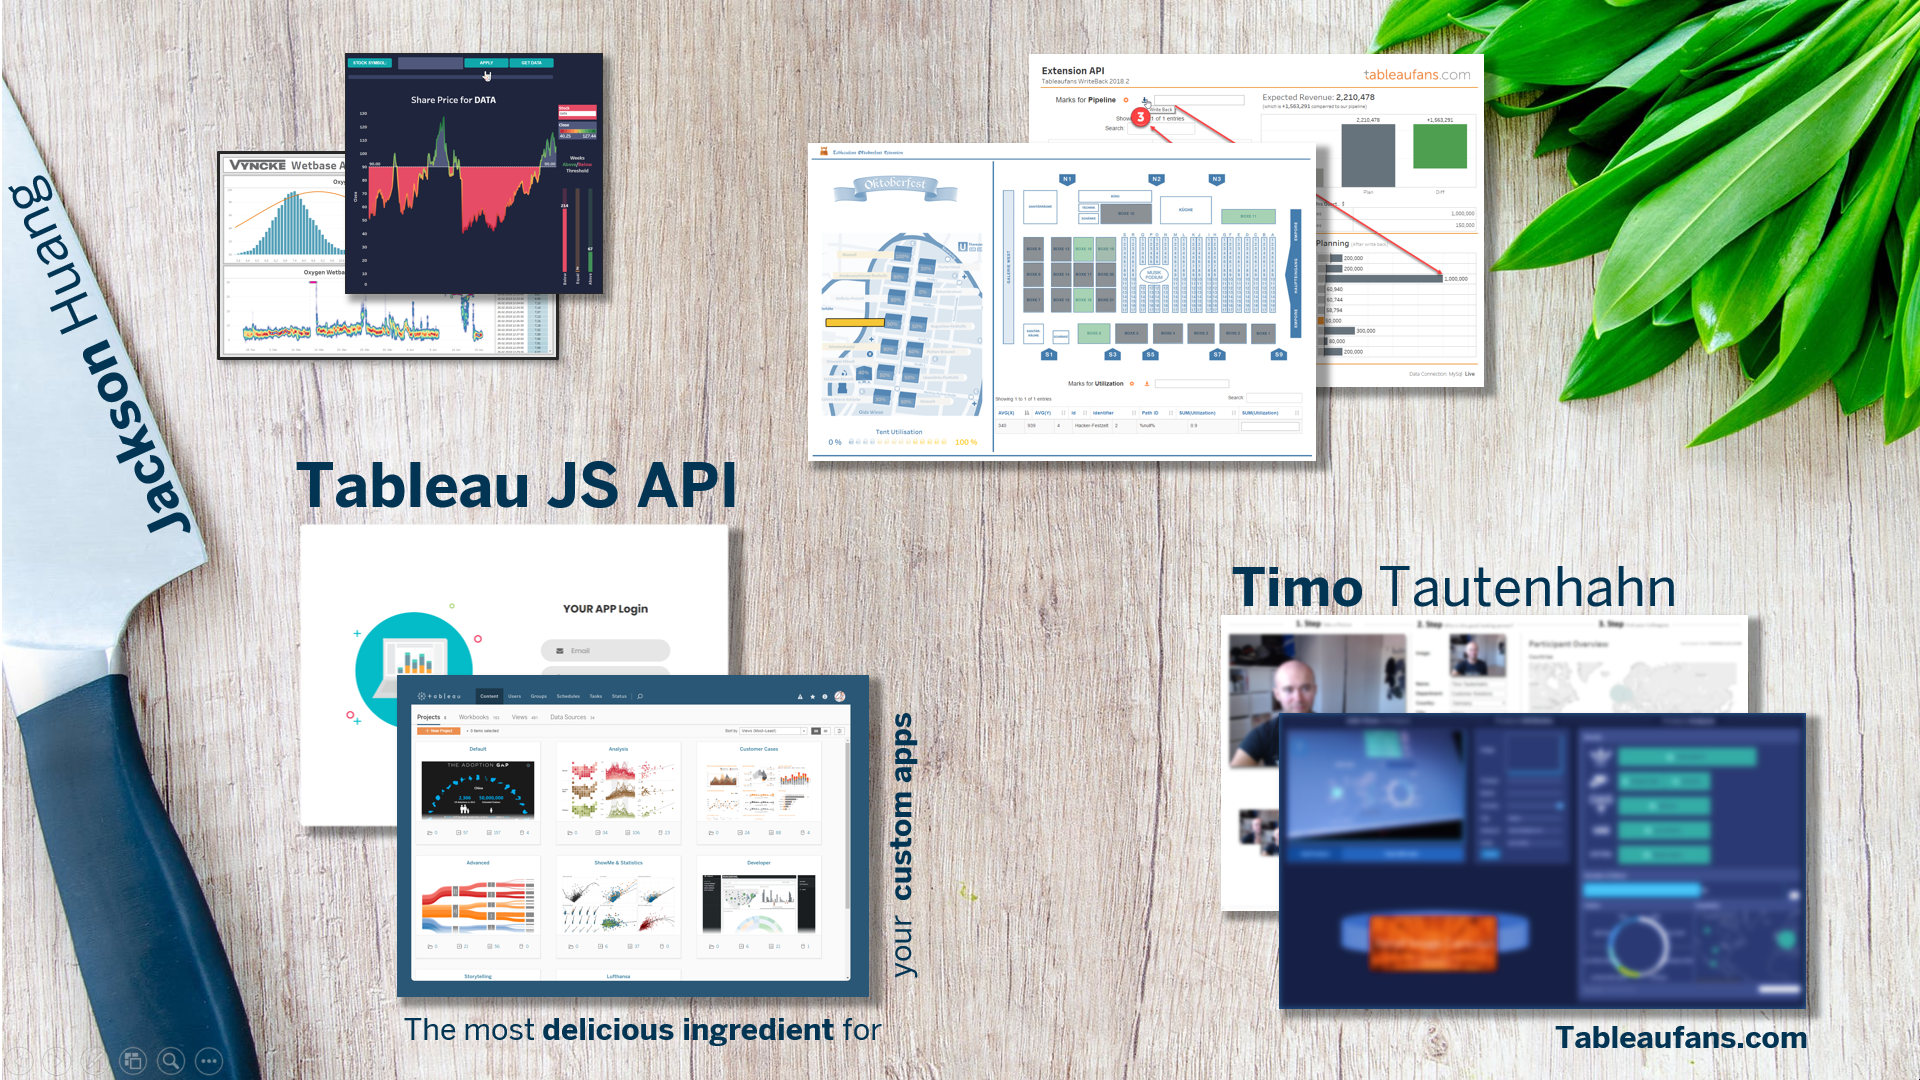
    Dear Tableaufans, are you ready for Tableau Conference in New Orleans? Jackson Huang and myself – Timo Tautenhahn – are going to have another FUN SESSION about embedding Tableau into your own apps called: “

    Tableau JavaScript API | The most delicious ingredient for your custom applications

    This session will jumpstart your Tableau JavaScript API skills with a live demo, it will show how other clients are leveraging it as well as some inspirational demos on “What else is possible with Tableau’s JS API”! We’d love to welcome you in one of our session this week!

  • Conference materials as videos on-demand

    Conference materials as videos on-demand

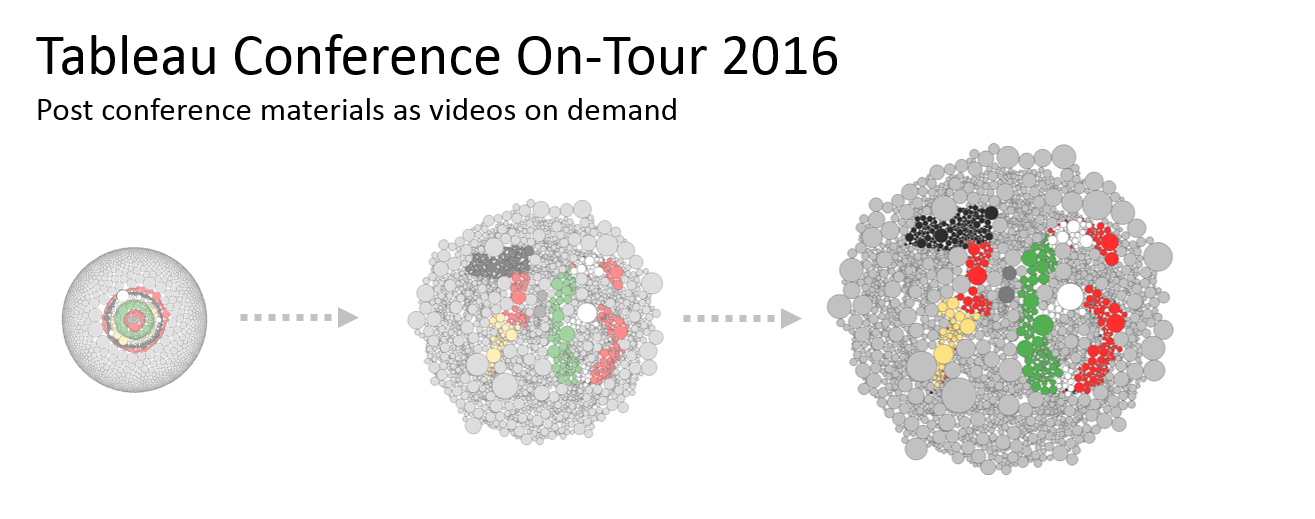
    Tableau’s last Conference On-Tour is over now. After Sydney, Singapore, Paris, London and Munich Tableau set the stage for it’s biggest event this year – TC Austin. Many of you, who attended Tableau Conferences in the past are already aware of the fact that you can’t attend all the sessions you’d love to see! Therefore Tableau offers the ability to watch most of the content as videos on demand afterwards!

    So here we go, feel free to watch sessions you couldn’t attend: Session Recordings German

    Content which was presented either by customers or which got delivered as part of Hands-on-Trainings are not necessarily recorded as Tableau was mentioning in Munich. If you’re interested in the content in English please have a look at London’s post conference material: Session Recordings

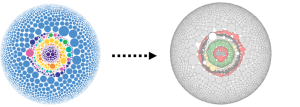
    P.S.Due to the fact, that recordings can’t be a replacement for beeing at a Tableau conference in person. So the image of this blog post is related to the last blog post, but it will just make sense if you’ve been part of the presentation “Artilize This” in Munich physically 😉

  • Art and Analysis

    Art and Analysis

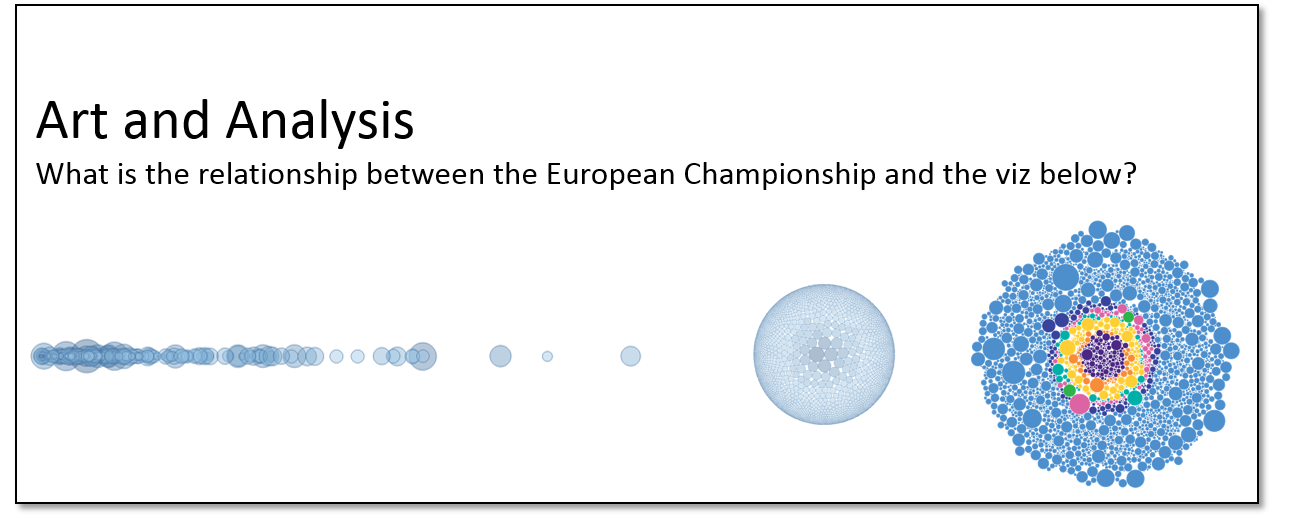
    You think the above picture does not make sense at all? Well, that’s not true! You just need to change color and sorting and you’ll figure out what’s within the bubble chart. To help you just a tiny little bit – here we go with the colors you’ll need to discover the unkown:

    Art and Analysis - The color you need to discover the unkown

    If you can’t figure it out without the data set you’re more than happy to join 1 out of 2 sessions about “Artilizing Data” at Tableau’s conference on Tour in Munich: