Kategorie

News
04
JUL
2016

Art and Analysis

Posted By : Timo Tautenhahn
Comments : 1
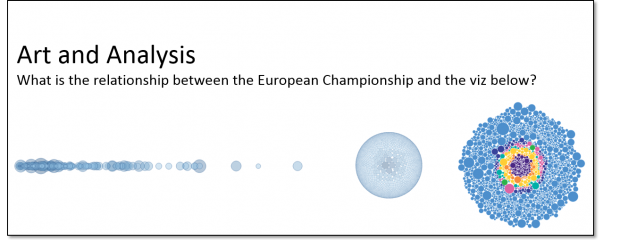
You think the above picture does not make sense at all? Well, that’s not true! You just need to change color and sorting and you’ll figure out what’s within the bubble chart. To help you just a tiny little bit – here we go with the colors you’ll need...
Read More
123

Categories

  • Admin Area (1)
  • Data Stories (1)
  • Developer (2)
  • Embedding API (2)
  • Extension API (11)
  • Geek Stuff (3)
  • Hacks (1)
  • Ideas (8)
  • Industry Related (1)
  • Neuigkeiten (6)
  • News (3)
  • Performance (2)
  • Salesforce (1)
  • SAP (1)
  • Success Stories (1)
  • Tableau 10 (1)
  • Tableau 9 (1)
  • Tableau Server (3)
  • Tipps & Tricks (10)
  • Tips & Tricks (1)
  • Tutorials (14)
  • Visual Inspiration (8)

Tags

artilize Azure bericht Cloud Cloud Database conference Datalake dynamisch embed Embedding Extension API Extract API html javascript api kpi mobile munich news on-demand on-tour parameter RLS Salesforce SAP SAP BW Security Snowflake SSO tc Write Back

Last posts

How to configure Tableau Online Single Sign-On with Salesforce as Identity Provider?

Monday, 16. November 2020

Tableau Extensibility Framework

Thursday, 17. September 2020

Embedding Tableau Responsively

Tuesday, 26. May 2020

Show Empty Rows and Columns

Tuesday, 24. December 2019

How to write back data to Snowflake?

Monday, 18. November 2019
  • Blog
  • About
  • Contact
  • Legal
© 2019 - tableaufans.com - All rights reserved
Concept and design: www.emodia.de